How to Forex - A Beginners Guide to Forex Trading - Part 4: Market Analysis

This is part 4 of my easy-to-follow series on Forex to teach you what Forex is and how to use it to make money.
How to Forex - A Beginners Guide to Forex Trading

Table of Contents
In this five part series you will learn:
An Introduction to Forex - What is Forex, the brief history of Forex, the benefits and risks of Forex
How to use Forex Platforms - Trading Applications, Brokerages, Opening live and demo accounts
Forex Trading Strategies - Trend trading, Scalping, Range trading, Breakouts, Signal trading, and Risk Management
Market Analysis - Fundamental and Technical analysis
Start trading Forex - Summary of all lessons, how to create your own strategy, the psychology of trading, and remembering the risks
4. Market Analysis
What is Market Analysis

Market analysis is when a trader analyses the market.
Market analysis is the process of studying determining factors, conditions, and characteristics of a market.
There are two types of Market analysis - fundamental and technical Analysis - a successful trader uses both.
Market analysis is used to help a trader predict - speculate - long term and short term price movements.
Market analysis is considered the most technical part of Forex trading.
Fundamental Analysis
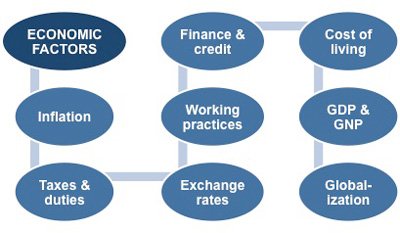
Fundamental analysis is an analysis of current economic factors.
Fundamental analysis uses statistical reports and economic indicators to predict the strength of a currency.
Fundamental Analysts use economic calendars to stay informed with the latest news reports / economic indicators.
There are four key types of economic indicators - Inflation indicators, Employment indicators, Consumer Activity, and Investor Activity.
Other types of economic indicators include - Housing prices / rates, Government expenditure, and taxes.
Types of Economic Indicators
Inflation Rates
Inflation rate is the rate at which goods and services rise. Good inflation rates indicate growth while deflation indicates a shortfall. Inflation that occurs too rapidly however weakens consumer buying as prices increase at a faster rate than salaries. Banks attempt to limit inflation and avoid deflation in order to keep the economy running smoothly
Interest Rates
Interest rates are the rate at which central banks lend funds. Central banks *increase* interest rates during periods of rapid inflation and *decrease* interest rates to boost the economy during deflation

GDP (Gross Domestic Product)
GDP is the total value of goods and services produced by a country within a time frame. It used to measures the level of inflation with the economy
CPI (Consumer Price Index)
Consumer Price Indices are statistical estimates that uses the overall price of goods and services to calculate consumer spending. CPI is used to measure inflation. High levels of consumer spending indicates inflation whereas low levels of consumer spending indicate deflation
Commodity Price Index
Commodity Price Indices track the average value of commodity prices such as oil, minerals, and metals. This index is particularly relevant for countries like Canada and Australia that serve as major commodity exporters. Increases suggest higher prices from these exports in the future
IPI (Industrial Price Index)
Industrial Price Indices measure the amount of output from the manufacturing, mining, electric and gas industries. Increases in IPI suggest continued economic growth
PPI (Producer Price Index)
Producer Price Indices measure the average change in selling prices received by domestic producers. PPI is used to measure inflation within domestic industries excluding volatile items such as energy and food
Employment Reports
Employment reports project current and future spending habits. They directly impact currencies as they project consumer spending within the economy

Retail Sales Report
Retail Sales Reports track consumer spending patterns. Increases in Retail Sales Reports suggests growing consumer confidence which is positive for the currency
Trade Balances
Trade balances compare the total value of imports to the total value of exports for a reporting period. A negative Trade Balance indicates that more goods were imported than were exported - a trade deficit. A positive Trade Balance indicates that exports exceeded imports - a trade surplus
ISM (Institute of Supply Management)
ISM reports measure the level of new orders to predict manufacturing activity for the upcoming period. ISM reports provide insight into the expected level of consumer demand for goods in the future
Technical Analysis
Technical analysis is a set of tools used to forecast future price movements.
Technical analysis identifies repeating price patterns.
Technical Analysts track a currencies history and trading volumes in an attempt to predict price patterns.
Technical Analysts identify price patterns to predict future market prices
Technical analysis uses tools and techniques such as indicators, oscillators, moving averages, and chart patterns.
Types of Technical Analysis
Chart Patterns
A chart pattern is a distinct formation on a stock chart that creates a trading signal, or a sign of future price movements. Chartists use patterns to identify trends / trend reversals and to trigger buy and sell signals.
There are four categories of charting patterns:
1. Channels
A price channel is the price action contained between two parallel lines
2. Trends
A trend is when the price action is moving in one definite direction
3. Reversals
A reversal is when the price action starts to move in the opposite direction
4. Continuations
A continuation is when the price action continues to move in the same direction
Types of Chart Patterns
Triangles
There are three types of triangle patterns - Symmetrical, Ascending, and Descending - which each indicate a potential breakout. Symmetrical triangles indicate a break out in either direction. Ascending triangles show a steady resistance level with higher lows indicating an upward breakout. Descending triangles show a steady support level with lower highs indicating a downward breakout.
Head and Shoulders
The head and shoulders is used to predict a trend reversal. A head and shoulders pattern illustrates a weakening in a trend by showing the deterioration in the movements of highs / lows. It is called a head and shoulders pattern because it consists of two shoulders a head and a neckline. We use the neckline to create a resistance / support level whilst the shoulders and head illustrate a reversal in direction.
Flag & Pennant
A flag / pennant indicate the continuation of a prices direction. A flag pattern consists of a large movement that looks like a flagpole which is then followed by a triangle pattern before continuing in the direction of the previous large movement. A pennant pattern consists of a large movement followed by a symmetrical triangle before continuing in the direction of the previous large movement.
Cup and Handle
A Cup and Handle pattern indicates a continuation once the pattern is formed. It consists of a rounding bottom pattern and a flag / wedge pattern. Once this pattern forms it will continue in the direction of the previous large movement.
Double Tops and Bottoms
A Double Top or Double Bottom indicates a trend reversal. A double top / bottom pattern consists of two resistance / support levels - this is because the price has tried to move beyond these levels twice. When a price fails to break a resistance / support level it indicates a reversal in price direction.
Triple Tops and Bottoms
A Triple Top or triple Bottom also indicates a reversal. A triple top / bottom pattern consists of three resistance / support levels - this is because the price has tried to move beyond these levels three times. Triple top / bottom patterns are only a good indication after they have formed as they are a harder pattern to predict when forming.
Wedge
A wedge is very similar to a triangle pattern. A wedge however in an upward or downward position. A wedge can last for long periods of time. A wedge does not indicates that the market is indecisive. A indicates either a continuation or reversal.
Moving Averages
A moving average is the average price of a currency over a set amount of time. By plotting a currencies average price, the price movement is smoothed out. Once the day-to-day fluctuations are removed, traders are better able to identify the true trend and increase the probability that it will work in their favor.
Simple Moving Average (SMA)
A simple moving average (SMA) is calculated by adding the closing price for a number of time periods and then dividing this total by the number of time periods. For example, in a 10-day moving average, the last 10 closing prices are added together and then divided by 10
Exponential Moving Average (EMA)
An *exponential moving average* is similar to a *simple moving average*, except that more weight is given to most recent data. This type of moving average reacts faster to recent price changes than a *simple moving average*
Indicators
Indicators are calculations based on the price and the volume of a currency that measure such things as money flow, trends, volatility and momentum. Indicators add additional information when analysing a currency. Indicators are used in two main ways: to confirm price movement and the quality of chart patterns, and to form buy and sell signals.
Trend Lines
Trend lines are drawn on charts to indicate previous *support* / *resistance* levels of a currency price
Candlestick Formations
Candlesticks indicate the open, close and change of a price within a time period. Candlesticks are the fundamental tool for analyzing current price movements. You may also choose to use a *granularity* or *bar chart* which both work in the same way. Candlesticks are the most common.
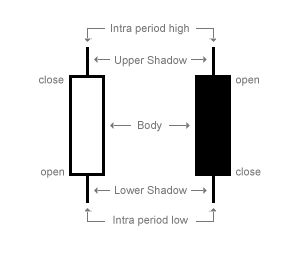
A hollow / red candlestick means that the bottom of the body represents the opening rate, while the top shows the closing price.
A filled candlestick, on the other hand, shows the opening rate at the top of the body and the closing rate at the bottom.
There are 7 types of Candlestick patterns:
 1. Doji Pattern -
A doji occurs when the opening and closing prices are basically the same price.
It indicates that there is no clear direction for the market.
 2. Gravestone Doji -
A Gravestone Doji occurs when the open and the close prices occur at the low of the reporting period.
This candlestick signifies the top of the market - resistance - has been reached and a reversal is a likely.
 3. Long-Legged Doji -
A Long-Legged Doji occurs when the open and close prices occur at the top of the reporting period.
This candlestick signifies the bottom of the market - support - has been reached and a reversal is likely.
 4. Spinning Tops -
Spinning Tops occur when there has been very little difference between the opening and closing prices.
They are seen as a sign of indecision pointing to the increased likelihood of a market reversal.
 5. Hammer & Hanging Man -
The hollow bodied image is a downtrend hammer and the filled body image is a uptrend hanging man. If you turned the image upside down it would show a downtrend hanging man and a downtrend hammer.
Both of these patterns suggest price uncertainty. A hammer likely represents a reversal.
 6. Morning Star -
A Morning Star appears as a small hollow-bodied candlestick that follows a declining, filled candlestick marking a turning point in the price.
It indicates that the price has reached a support level after a declining market.
 7. Evening Star -
The Evening Star occurs at the end of a downward trend.
It appears just before a major decline in prices.
 8. Shooting Star -
A shooting star indicates that a price movement is about to come to a halt.
This Shooting Star indicates that the the market is pausing to reflect on the current price direction.
Fibonacci Retracements
Fibonacci retracement levels use horizontal lines to indicate areas of support or resistance at the key Fibonacci levels before the trend continues in the original direction. These levels are created by drawing a trendline between the high and low and then dividing the vertical distance by the key Fibonacci ratios of 23.6%, 38.2%, 50%, 61.8% and 100%
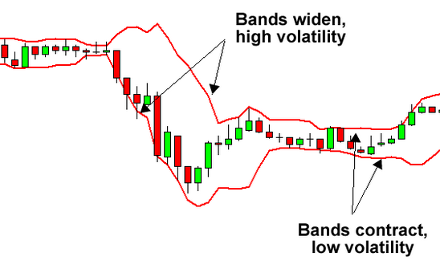
Bollinger Bands
Bollinger Bands are placed over a price chart and consist of a moving average, together with upper and lower bands that define pricing channels. They are used to measure the volatility of a currency
Oscillators
Oscillators are indicators that are used when viewing charts that are non-trending. Oscillators are used when the charts are not showing a trend in either direction. Oscillators are thus most beneficial when a company's stock either is in a horizontal or sideways trading pattern, or has not been able to establish a definite trend in a choppy market.
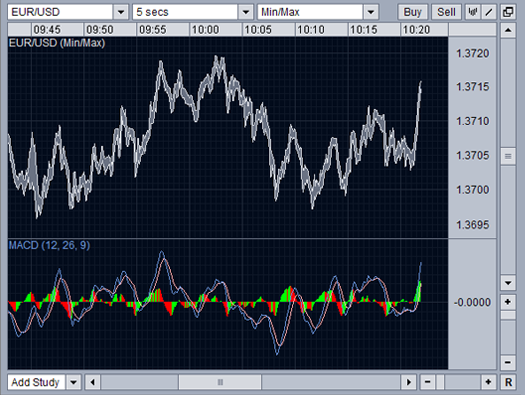
MACD (Moving Average Convergence / Divergence)
The MACD Oscillator uses moving averages to look for trade signals generated when moving averages either converge or diverge from each other. When these two averages cross over - converge - it is an indication of price reversal. If these two averages diverge it is an indication the the price is continuing in its current direction.
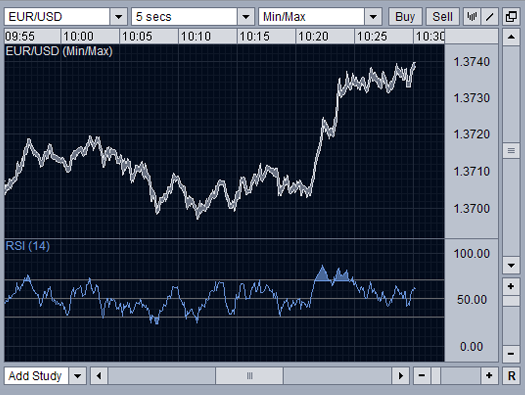
Relative Strength Index (RSI)
An RSI measures the strength of the rate movement. It creates an average price range and calculates the movements from the mean. The greater the strength of the trend, the further the price can move from the average. An RSI calculates a trend's ability to *break away* from the average mean rate.
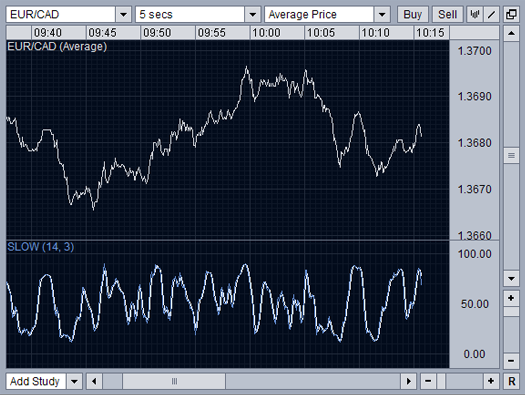
Stochastic Oscillator
The Stochastic Oscillator measures the strength of a current trend. As a market moves upwards, it will close at the upper end of the reporting period's range. As a market moves downwards, it will close at the bottom of the reporting period's range. There are two basic stochastic types – fast stochastics and slow stochastics - the latter is the more reliable indicator.
Now you know Market Analysis
In the last part of this How to Forex series we will use what we have learned to start trading strategy
The last part of this series will include:
- A summary of all previous lessons
- How to create your own trading strategy
- A definition of trading psychology
- A reminder of the risks involved when trading
I will try add each part of this series within 24 hours of one another
You can view Part 1 of the series here
You can view part 2 of the series here
You can view part 3 of the series here
Thank you for reading this article
This article is exclusive to Steemit
It has been provided to you by @senseiteekay - An Anarcho-Socialist & Entrepreneur
All learning resources and references for each part of this series will be linked below
If you would like to donate towards my work you can do so using the button below
Disclaimer:
The contents herein these articles are not investment advice. Follow this guide of your own accord. If you do choose to follow these guides do so at your own risk. I am not a qualified professional. I am self taught and provide these guides as a guide only and not as a step-by-step rule to make money.
The Forex market carries many risks and anyone who decides to trade on Forex should know these risks before opening an account. I advise you to fully read each part of my series and to also do further research if there's anything you do not understand herein these guides.
Please be safe when trading.
Learning Resources & References:
http://www.dictionary.com/browse/market-analysis
https://www.oanda.com/forex-trading/learn/intro-to-currency-trading/fundamental-analysis/monetary-policy
http://www.investopedia.com/terms/i/inflation.asp
https://en.wikipedia.org/wiki/Consumer_price_index
http://www.investopedia.com/terms/g/gdp.asp
https://en.wikipedia.org/wiki/Consumer_price_index
http://www.investopedia.com/terms/i/ipi.asp
http://www.investopedia.com/terms/p/ppi.asp
http://www.marketgeeks.com/technical-analysis-of-stock-market/
http://www.investopedia.com/terms/p/price-channel.asp
http://www.investopedia.com/terms/t/trend.asp
http://www.investopedia.com/terms/r/reversal.asp
http://www.investopedia.com/university/technical/techanalysis8.asp
http://www.investopedia.com/terms/e/ema.asp
http://www.investopedia.com/university/technical/techanalysis9.asp
https://www.oanda.com/forex-trading/learn/intro-to-currency-trading/technical-analysis/patterns
https://www.oanda.com/forex-trading/learn/intro-to-currency-trading/technical-analysis/candlesticks
http://www.investopedia.com/terms/f/fibonacciretracement.asp
https://www.oanda.com/forex-trading/learn/intro-to-currency-trading/technical-analysis/bollinger-bands
https://www.oanda.com/forex-trading/learn/intro-to-currency-trading/technical-analysis/oscillators

I really need to learn to read this stuff lol. Thanks for the lesson!
Nice continuation of the series. I prefer fundamental analysis though, and of course risk analysis. I think the biggest factors that can give you an edge always come from outside, the money coming from outside people, and rarely from inside people. So macroanalysis of the markets is preferable in my opinion. I just made + 90% profits with Monero this way.
Happy to hear about your Monero profit, I just benefited from the same.
You're exactly right too. Macroanalysis is my favorite kind of market analysis.
I was very tempted, when writing this part of the series, to talk about my own trading preferences but I felt it may have strayed people towards following my own preferences rather than learning useful techniques for themselves.
I will be going into risk analysis in the next part of the series when I teach people how to build their own strategies using the tools I have given them in the first parts of this series.
Thanks for your input @profitgenerator. It's sincerely appreciated.
Upppp. Good info
Fantastic post. I'm not sure home much I buy into all of this but it is useful to know.
Indeed. It's not without its risks. I've mentioned these risks multiple times throughout the series.
Stay tuned for the last part of the series where I will teach you how to put it all together into a working strategy and how managing the risks is the key to becoming successful on Forex.
thanks for information on how to learn forex. I had never learned forex
@senseiteekay
not convinced. This looks like magical thinking. Google "post-hoc fallacy" and learn everything about it.
I've only posted the more proven methods of analyzing the market. Fundamental analysis is the most promising way to speculate price movements. There's never any guarantee that a price will move in your favor though and therefore I guess you could say that TA (Technical Analysis) is some what like post hoc fallacy.
I can say though that from my own personal experiences, technical analysis does work. You just have to manage your risks properly when first entering a trade and pay attention when there's a new development.