Analysis of Yesterday's NZD/USD Price Action and How I Traded it
NZD/USD Key Points
- Higher time frame, NZD/USD resistance holds.
- Price pulls back into intraday short term support turned resistance.
- Continues to fresh new lows.
Morning Musings
Afternoon team,
It's been a great trading week for us, all thanks to our original NZD/USD short setup. As a result, we haven't really been pressured to look for good new setups that quite honestly, just aren't there at the moment.
Alongside the Kiwi, all of the majors have made huge moves that almost feel exhausted at this point. If we jump onto them now, we aren't getting the ideal risk:reward ratio that my whole trading philosofy is built around.
With our NZD/USD shorts continuing lower, I wanted to analyse yesterday's price action and how my trading strategy takes advantage of these big momentum moves.
NZD/USD Technical Analysis
A quick summary of my trading strategy is as follows:
"I wait to see if price holds a higher time frame support/resistance zone to find which direction I want to trade in."
"Then I zoom into an intraday chart to find a pullback into previous short term support/resistance in that higher time frame direction to get entries with excellent risk:reward."
Let me explain things while looking at yesterday's price action on the 15 minute chart:

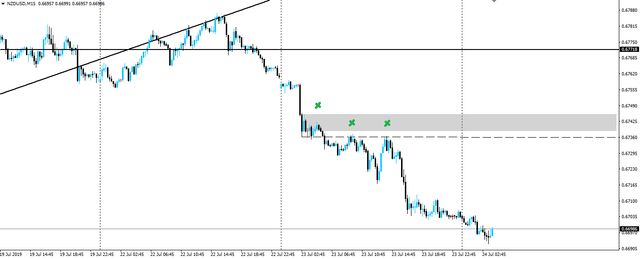
The solid horizontal line is the bottom of a higher time frame zone that comes from resistance on the daily chart (click back to Monday's analysis and you can see the zone I'm talking about). As price held higher time frame resistance and moved lower below it, we were looking only for shorts.
Now looking at yesterday's intraday price action, you can see that price first stalled at the candle I've drawn the grey box from. This is the short term area of support that we are going to use as an entry IF it retests as resistance.
You can see that price moved lower again and then retested the area of short term support turned resistance three more times where I've marked the chart. It's on these pullbacks where we look to short.
You can see that with your stop above either the short term, or higher time frame zone, you would have made money trading yesterday's price action using this strategy.
Best of probabilities to you.
Dane.
Upcoming Economic Releases
USD Advance GDP q/q
@forexbrokr | Steemit Blog
Market Analyst and Forex Broker.
Join my Inner Circle ⭕️ - www.forexbrokr.com
Good stuff.
You can use this tag
#steemleo
At steemleo.com
It is about investment in that sphere.
Posted using Partiko iOS
Thanks mate, I’ll have to check it out.
I’ve sort of been avoiding all of the new community tokens that have been popping up because it’s all so overwhelming.
I have to take the jump and get involved!
Posted using Partiko iOS
Excellent Analysis!
Well look who it is.
Power up some STEEM and finally get involved!
Posted using Partiko iOS
Will give it a go!