$FCT/BTC Technical Analysis "in the middle of difficulty lies opportunity"
Hello Steemers!
Today I will do a FCT/BTC chart analysis, based on the daily Poloniex chart.
Legend
Red full lines - previous highs, which were used as support in the past and are possible support in the future
Red dashed lines - previous highs, which turned into new low's ( blue dashed lines) . those might be bit hard to see
Blue dashed lines - previous lows, which were used as resistance in the past and are possible resistance in the future
Let's start with an full overview.
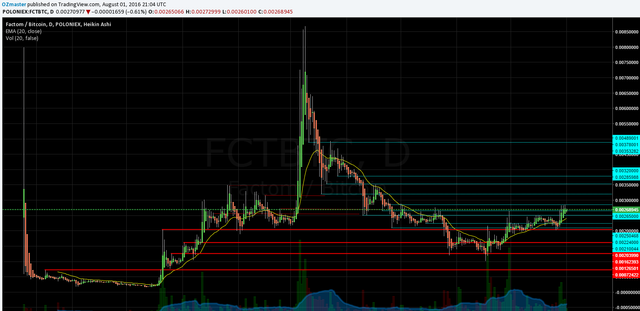
1 day chart Poloniex - 01/08/16
As I usually do on the daily charts, I marked some historical highs and lows, which should indicate future support/resistance levels. I want to point out the dark red dashed lines, those are previous tops which turned into new low's, so what was previously acting as a support is now acting as a resistance. I know the chart has allot of lines, but i'll keep repeating, I like to have an complete overview so I don't have to redo the chart's everyday, but it'l get cleaner towards the end I promise :).
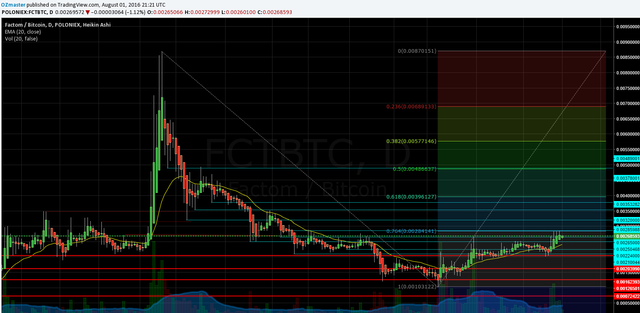
1 day chart Poloniex+ fibs - 01/08/16
Most of you surely noticed that I like combining fibs with the previous support and resistance levels.
No tool, so not even fibs or highs and lows on it's own will give you any "magical" overview, but combining 2 or more might just give you what you are looking for.
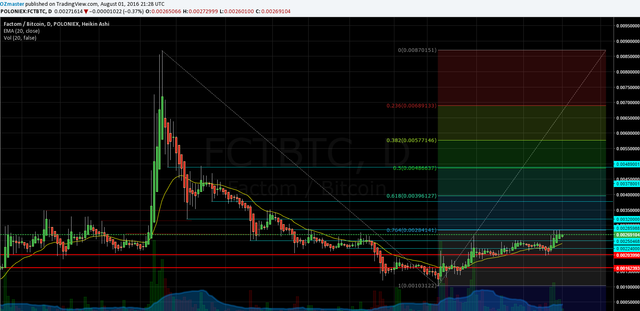
1 day chart Poloniex- fibs+ clean1 - 01/08/16
Now this is the 1st cleanup of the chart.
I left the lines which seemed to have a higher importance in the history(acted more times as support/resistance levels, stick out) or the ones which closely follow the fib lines. I expect those lines to act as "major" support and resistance levels, marking new local highs and support levels.
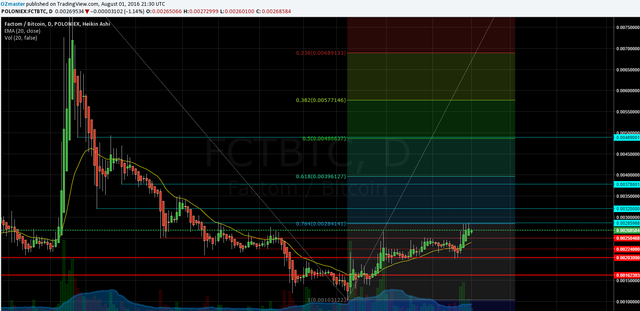
1 day chart Poloniex- fibs+ clean2 - 01/08/16
Cleanup #2, notice how i changed the color of the bottom 2 blue lines into red, since they stopped acting as a resistance (the price went higher) I expect the to act as a support level n the near future, that for the change.
COMMENT
As you can see Factom already had a heavy pump, from 17k satoshi all time low to a 869k satoshi all time high.
After reaching the all time high the price started a hard and rapid downtrend.
After a long time of downtrend the price showed some bottom ~100k satoshi.
Big buys started, after a long time there was big volume on the buys, which let us know it might be a possible bottom.
The price kept on rising with respective volume on the buys till the ~200k satoshi range.
After reaching ~200k satoshi the volume starts fading away once again, but the price keeps holding above the 200k levels. A bit of volume showed in the last few days on the buy side but nothing serious to confirm the new uptrend with 100% currenty. If not change of trend into uptrend we are definitely going sideways into accumulation mode, the prices below 100k satoshi level's are way behind FCT.
There is nothing that indicates any significant danger of downtrend as far as the chart goes.
It looks like we can look forward to seeing volume in the FCT charts in the near future, whcih means there should be allot of trade opportunities. I'd strongly suggest the traders out there to keep a close eye on #Factom!
If anyone has any questions or need's help fell free to ask, I will try to explain as fast and as best as I can.
Critics, comments, reply's, counters, advice's, etc. are always welcome!
Have my charts helped you in any way?Let me know with a comment below :)
Are there more people who are doing TA?
Disclaimer I am showing multiple scenarios on the price movement, in the post itself I do not take any stance, either bullish or bearish. I am not responsible for neither you’re winning nor you're losses upon trading!
Kind Regards, OZ :)
Great analysis as usual, Oz. I'm all bullish on SysCoin right now. I guess i should give Factom another peak.
SyS! right, totaly forgot to check that one out, I was into SysCon not so long ago :)
Good stuff OZ. Keep em coming.
Thanks kushed :) glad u likem! hope they help!
you possess global management theory?
I've seen quite a few articles, although that's the first FCT that I came across. There could be more (or not?) - I don't know.
thanks information @ozchartart
no problem toroiskandar!:)
OZ charts must daily read 8]
thanks gekko, glad to have you following me:)
Hello, please check out my idea on getting more posts rewarded:
https://steemit.com/steemit/@lorddominik007/my-thoughts-on-steemit-an-idea-to-help-great-posts-be-recognized
Thanks for the informative Info:)
thanks litali, hope the TA helped to get a better view of the market!
Great charting again! looks allot more simple as u scroll down the post ! good work!
Nice chart and explain, thanks
no problem, glad you liked it!
As usual your analysis is straightforward and easy to follow and best of all, grounded in fact. I've added Factom to my radar and will be looking to accumulate on any significant pullbacks.
Glad you like my TA:)
FCT is defo a coin to keep the eyes on