Sunday Overview - Bitcoin Litecoin Ethereum Bitcoin Cash - Trade ideas to swing over the week.

It's sunday, what are we looking for next week?
Bitcoin
Bitcoin has shown significant weakness near its all time highs driven by bearish volume and has set lower highs and lower lows on the intraday time frames. Very likely to be an oversold bounce near term, however momentum may not be there to drive the next leg higher. This bounce could be short lived if it happens at all. If it does, a lower high here would likely drive the next leg lower.
Trade: Manage risk - Take profits, raise capital to buy dips or buy on a break out.
Risk Trade: Buy here, set a stop loss below 68 ema, $3904.
Alternative: Diversify by purchasing Alt cryptos.
If breaks down, Bearish targets: $3808, $3600's, $2900's
If breaks higher on VOLUME, Bullish targets: $4550, $4800, $5000
After a run like bitcoin had it is my personal view that it will retrace up to 61.8% of the recent rally, Fibonacci level which would be a 38% decline and we would look to buy that dip.
Daily Chart

4 Hour Chart

After running from $2929 to $4400-$4500, it was expected that there would be profit takers and that the price action needs to at least consolidate.
30 minute Chart vs. 1 Hour Chart
We are watching for a full 30 minute stochastic cycle on the 30 minute chart and how much damage or progress happens during. Note the Moving Average cross on the 30minute and the bearish twist in the ichimoku cloud.

Ethereum
Ethereum has been consolidating in a range between $280-$319 forming a bull flag on the daily time frame. We will be looking for volume to drive a break higher. Must hold support is $282, resistance to break and capture is approximately $304-$307.
Trade: Enter here, set stop loss $278
Alternative: Buy on breakout volume confirmation, approximately $308-$310
Daily Chart

4 Hour Chart

LiteCoin
Litcoin is clearly consolidating on a historic trendline which denotes that through all of the recent crypto swings, Litecoin is one of few that has maintained a steady up trend and is now forming a tightening pattern known as a wedge.
Trade: Buy here, set stop loss $42, $39 for a higher risk tolerance
Alternative: Buy on break above wedge, approximately $48.
Daily Chart

4 Hour Chart

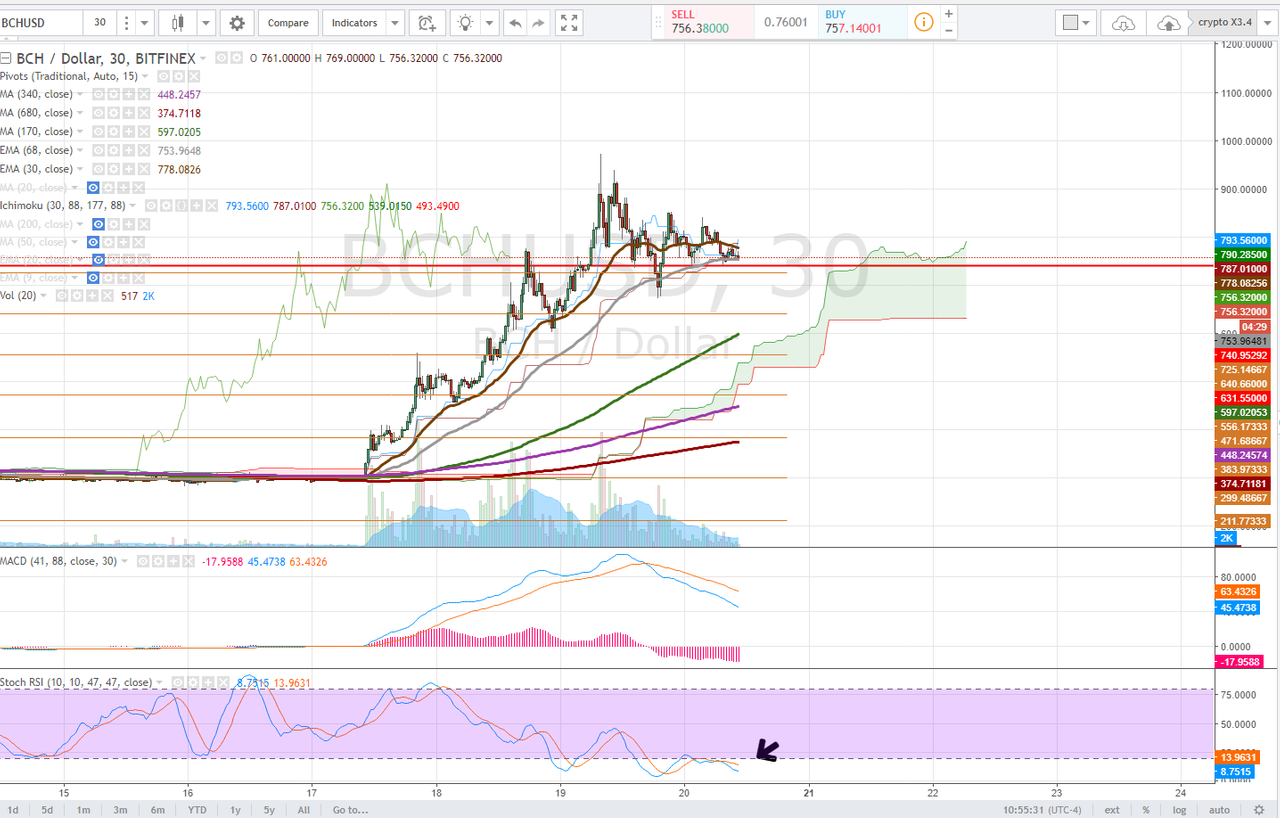
BitCoin Cash
Bitcoin Cash had rallied 177% before finally pulling back to consolidate. This is a HIGH risk trade, not for the faint of heart. I am observing a bullflag on the 4hour time frame, but what may end up as a very bearish candle stick on the daily time frame. I advise on a chart like this, investors or those with little trading experience wait for a steep pullback to enter.
Risk trade: Enter here, set stop loss at approximately $715 (very loose as there would be volatility on a any kind of move)
Alternative: None
Edited: BCC bull flag broke down and dipped, you would watch for lots of bullish volume to come in on this dip to re-enter
Daily Chart

4 Hour Chart

30 Minute Chart
Watching for an oversold bounce as the price consolidation continues to squeeze. Walk stoplosses up with price progression if any.
The Importance of sell stops to preserve capital
Follow at your own risk, Not a financial adviser, understand the risks associated with trading and investing. Manage your own Risk - in other words you could lose it all and I could give a fuck.

wow...quite an informative post...good one...upvoted as always
Thanks
welcome dear as am always here to support good steemins.. find time also to check my blog posts
regards
@satchmo got you a $1.55 @minnowbooster upgoat, nice! (Image: pixabay.com)
Want a boost? Click here to read more!