$ETH/BTC Poloniex Technical Analysis Jan. 02, 2017.
Hello Steemers!

Doing an update on the Ethereum ($ETH)chart today. Last ETH chart I did was 4 months ago.
Currently ranked 2nd on coinmarketcap.
Fore more info about Ethereum check out their website and their forum:
Website - https://www.ethereum.org/
ETH forum - https://forum.ethereum.org/
Starting with the old chart from Sept. 07, 2016. (https://steemit.com/ethereum/@ozchartart/usdeth-btc-poloniex-technical-analysis-sept-07-2016).

daily chart Poloniex - Sept. 07, 2016

weekly chart Poloniex - Sept. 07, 2016
Coming up next, the new charts, without any new lines added.
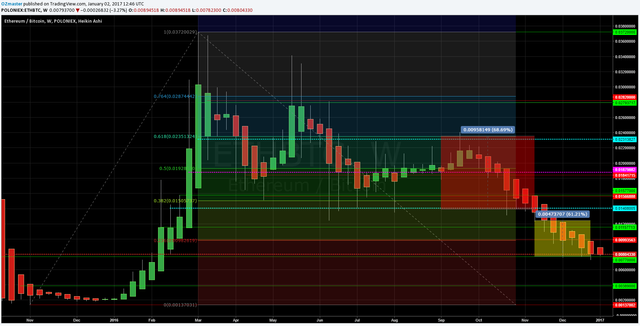
weekly chart Poloniex - Jan. 01, 2017
Since the last update the price did a run up towards the 0.0231 BTC resistance, briefly spiking through it and making a new local high at 0.0241 BTC.
After the bounce came a 2 week flat out around 0.022 BTC, which then was followed by a sharp dump to the 0.00185 support zone.
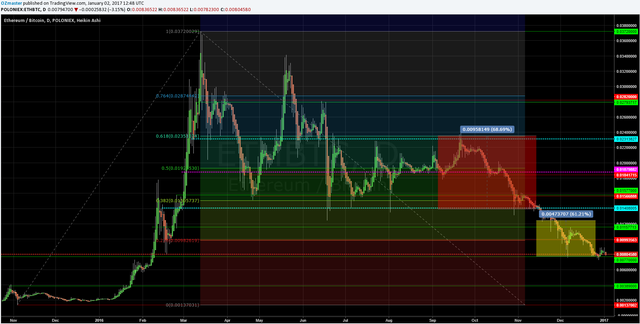
daily chart Poloniex - Jan. 01, 2017
After a few days of trying to hold the 0.0185 support zone, the price broke on the downside once again, dumping pretty sharp towards the next, ~0.014 support zone where the price tried to do a turn but without success, it went down again and met the 0.0077 BTC support line, where it marked a new local low and bounced up touching the 0.0115, the next possible resistance on the up side.
Just a few days after the price started going down and came to the 0.0077 BTC support line once again, marking just a bit lower local low then few days earlier..
Followed by a small bounce to 0.009 BTC, it is now again painting a red candle and trading at around 0.008 BTC.
New charts with new lines, adding the 4 hour chart this time as well.
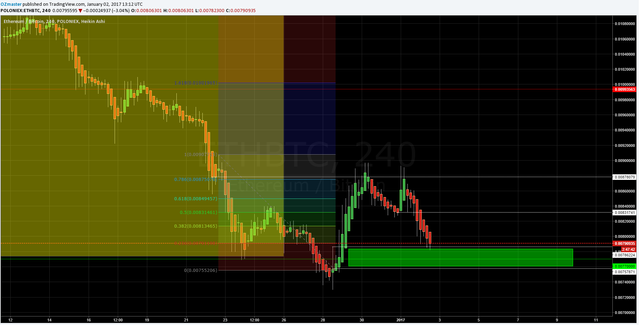
4 hourly chart Poloniex - Jan. 01, 2017
Pulled 4 new lines on the 4 hour chart (white lines),marked a support zone between ~0.00757 and the ~0.00786 BTC line with the green color and added a small fib.
The fib shows that the support zone is also within the lowest fib level tone, and provides 2 possible resistance points on the upside, the ~0.0081 BTC line and the ~0.0083 BTC line which correlates with one of the lines i pulled from the bottom of a wave. I see the 0.0083 BTC levels playing an more important role here.
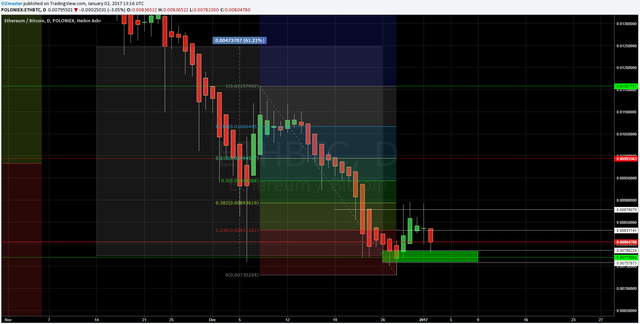
daily chart Poloniex - Jan. 01, 2017
On the daily I pulled a bit bigger fib, the bottom of this fib shows how after the small bounce, the price was retained around the 0.0083 BTC line which is another confirmation for me that it might play an important resistance level on the upside.
The next fib line is at ~0.00893 BTC, to around where the price went up to in the last bounce, another possible resistance zone there.
weekly chart Poloniex - Jan. 01, 2017
For the weekly I didn't add any new lines, my old ones seem fine to me. I like it how it is at the moment.
What to expect?
On the lower time frames (used the 4 hour chart):
1st (green) - The support zone between 0.0075 and 0.00786 BTC will hold and the price will enter a uptrend going towards the 0.00831 BTC line.
2nd (red) - The support zone between 0.0075 and 0.00786 BTC fails to hold the price up and ETH drops into new local lows.
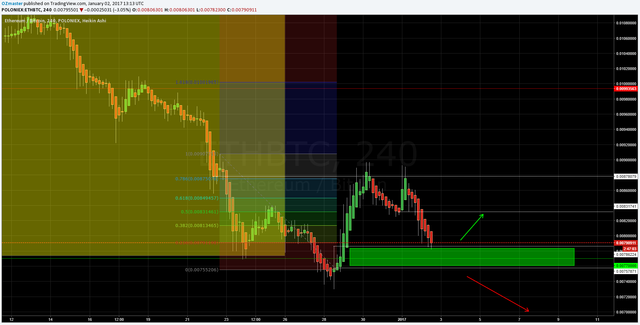
4 hourly chart Poloniex - Jan. 01, 2017
On the bigger time frames (used the weekly chart):
1st (green) - The price marked a new bottom at 0.0073 BTC and the price starts a reasonably hard uptrend breaking through resistance lines and making new higher local highs along the way.
2nd (yellow) - The price enters an accumulation zone between ~0.0077 and the ~0.00115 BTC line
3rd (red) - The price drops lower to the 0.00389 BTC around where it marks a new bottom and slowly starts turning up.

weekly chart Poloniex - Jan. 01, 2017
COMMENT
Once again, I will post the comment by commenting as it involves my personal opinion!
Thank you for understanding!
If anyone has any questions or need's help fell free to ask, I will try to explain as fast and as best as I can.
Critics, comments, reply's, counters, advice's, etc. are always welcome!
Have my charts helped you in any way?Let me know with a comment below :)
Are there more people who are doing TA?
Please post the links to your TA's posts into the comments as well!
DISCLAIMER
I am showing multiple scenarios on the price movement, in the post itself I do not take any stance, either bullish or bearish. I am not responsible for neither you’re winning nor you're losses upon trading! the "comment" section is my personal opinion and does not mean I have to or do hold any positions in the given market.
Everyone who uses TA develops his own unique charting style, please keep that in mind.
Kind Regards, OZ :)
COMMENT
Depending on how the situation in the smaller time frames plays out, if the ~0.0077 BTC support holds or not, I see this 2 possibilities coming.
As for some other coins on the market I think this might be decided due to the Bitcoin moves.
great post
eth up on febrery 2017
damn so much good stuff!
added you to my bot now.
happy new year :)
Really must add ethereum to my plan now...thankyou, a complete noob myself but can just follow Ta when laid out as you do.Generally form opinion based on this and all Blockchain news The Big Picture so to speak.