$2,000 Ethereum Incoming? - A Technical Outlook - 1/20/2018
Hey fam.
Welcome to a quick technical outlook for Ethereum (ETHUSD). In my opinion, this is looking a lot stronger than Bitcoin is, which you can read my thoughts on over at the BTCUSD, A Technical Update - 1/20/2018 post.
Let's dive in and take a look.
This one I am going to keep a bit more simple as I believe that Ether, like most cryptos this past week, was subject to the downside in market cap which was triggered by emotions surrounding bitcoin itself.
Ether is holding its market structure extremely well and is now showing signs of strength coming back into it, even after the fork for EtherZero that happened just last night.

The area I want to bring your attention to is the last time we saw Ethereum drop based on overall market cap downfall. Which was at the $830 price range. If you take a look at the chart above you will see that is saw a very nice spike down to it's old structure at the $500 price range, hitting the demand zone and then immediately coming back up. This was then followed by a small accumulation period before it continued its trend back up.
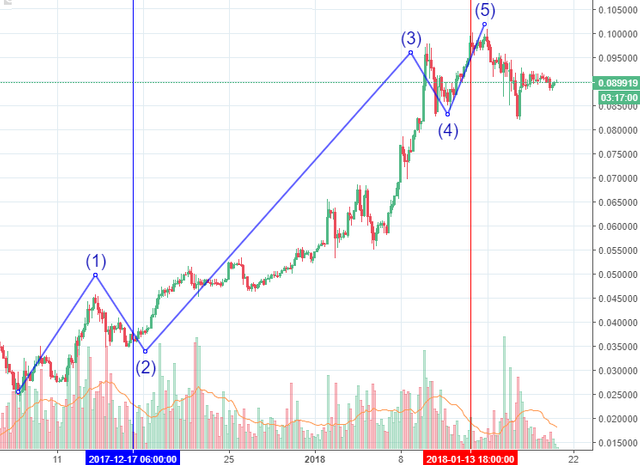
From that leg up and push down we had drawn out some Fibonacci Extension points, one of my favorite tools, and got potential long term targets, which is where we are trading at now. You can see that the 100, 123. AND 161.8% targets were met before the market decided that it was time to cool off.
This brought the same scenario into play, a very quick spike down to its old zone at $750-$825 price range.
Since then we have spent a few days accumulating orders and are now rising off of those levels with great demand.
Assuming we see history repeat itself, we can measure the potential future move using the same fibonacci extensions which you can see at the top of the chart. The price targets that this suggest are as follows:
100% FE: $1,677
123.6% FE: $1,890
161.8% FE: $2,240
You may also notice that we have the 261.8% FE that remains to be hit from the lower zones. This ends up right between the 100% and 123.6% new extensions, which adds confidence to the new zones we have marked out.
Now as suggested in the bitcoin thread, see link above, it is possible that the market continues to distribute. Although I see less of that showing on this Ethereum chart it is subject to fall into that same possibility.
As always, this is NOT financial advice is just meant to open your eyes to possible price swings for your own judgement and decisions. I do not recommend you trade based off this and do your own research/analysis.
See you guys on the next market update.
Thanks for your analysis, @byscag!
I guess that Ethereum is about to make at least one more strong corrective motion. Here is also an ETHBTC chart:
Correction is expected there as well!
Yeah the ETH/BTC chart has been on an impressive run as well. Thanks for sharing!
ETH is the biggest part of my portfolio so higher prices would definatley be pretty awesome 📈
Good analysis.
Thank you @kiron60, appreciate the comment.
Very interesting
Ethereum is awesome. I just ordered a book about it from Amazon so that I can learn the ins and outs of the blockchain. Great article @byscag please keep them coming.