BTCUSD, A Technical Update - 1/20/2018
Hey everyone, welcome back to another bitcoin technical update.
In this post we will explore the current moves on bitcoin and highlight key areas to watch for reactions to adapt to what the market is telling us.
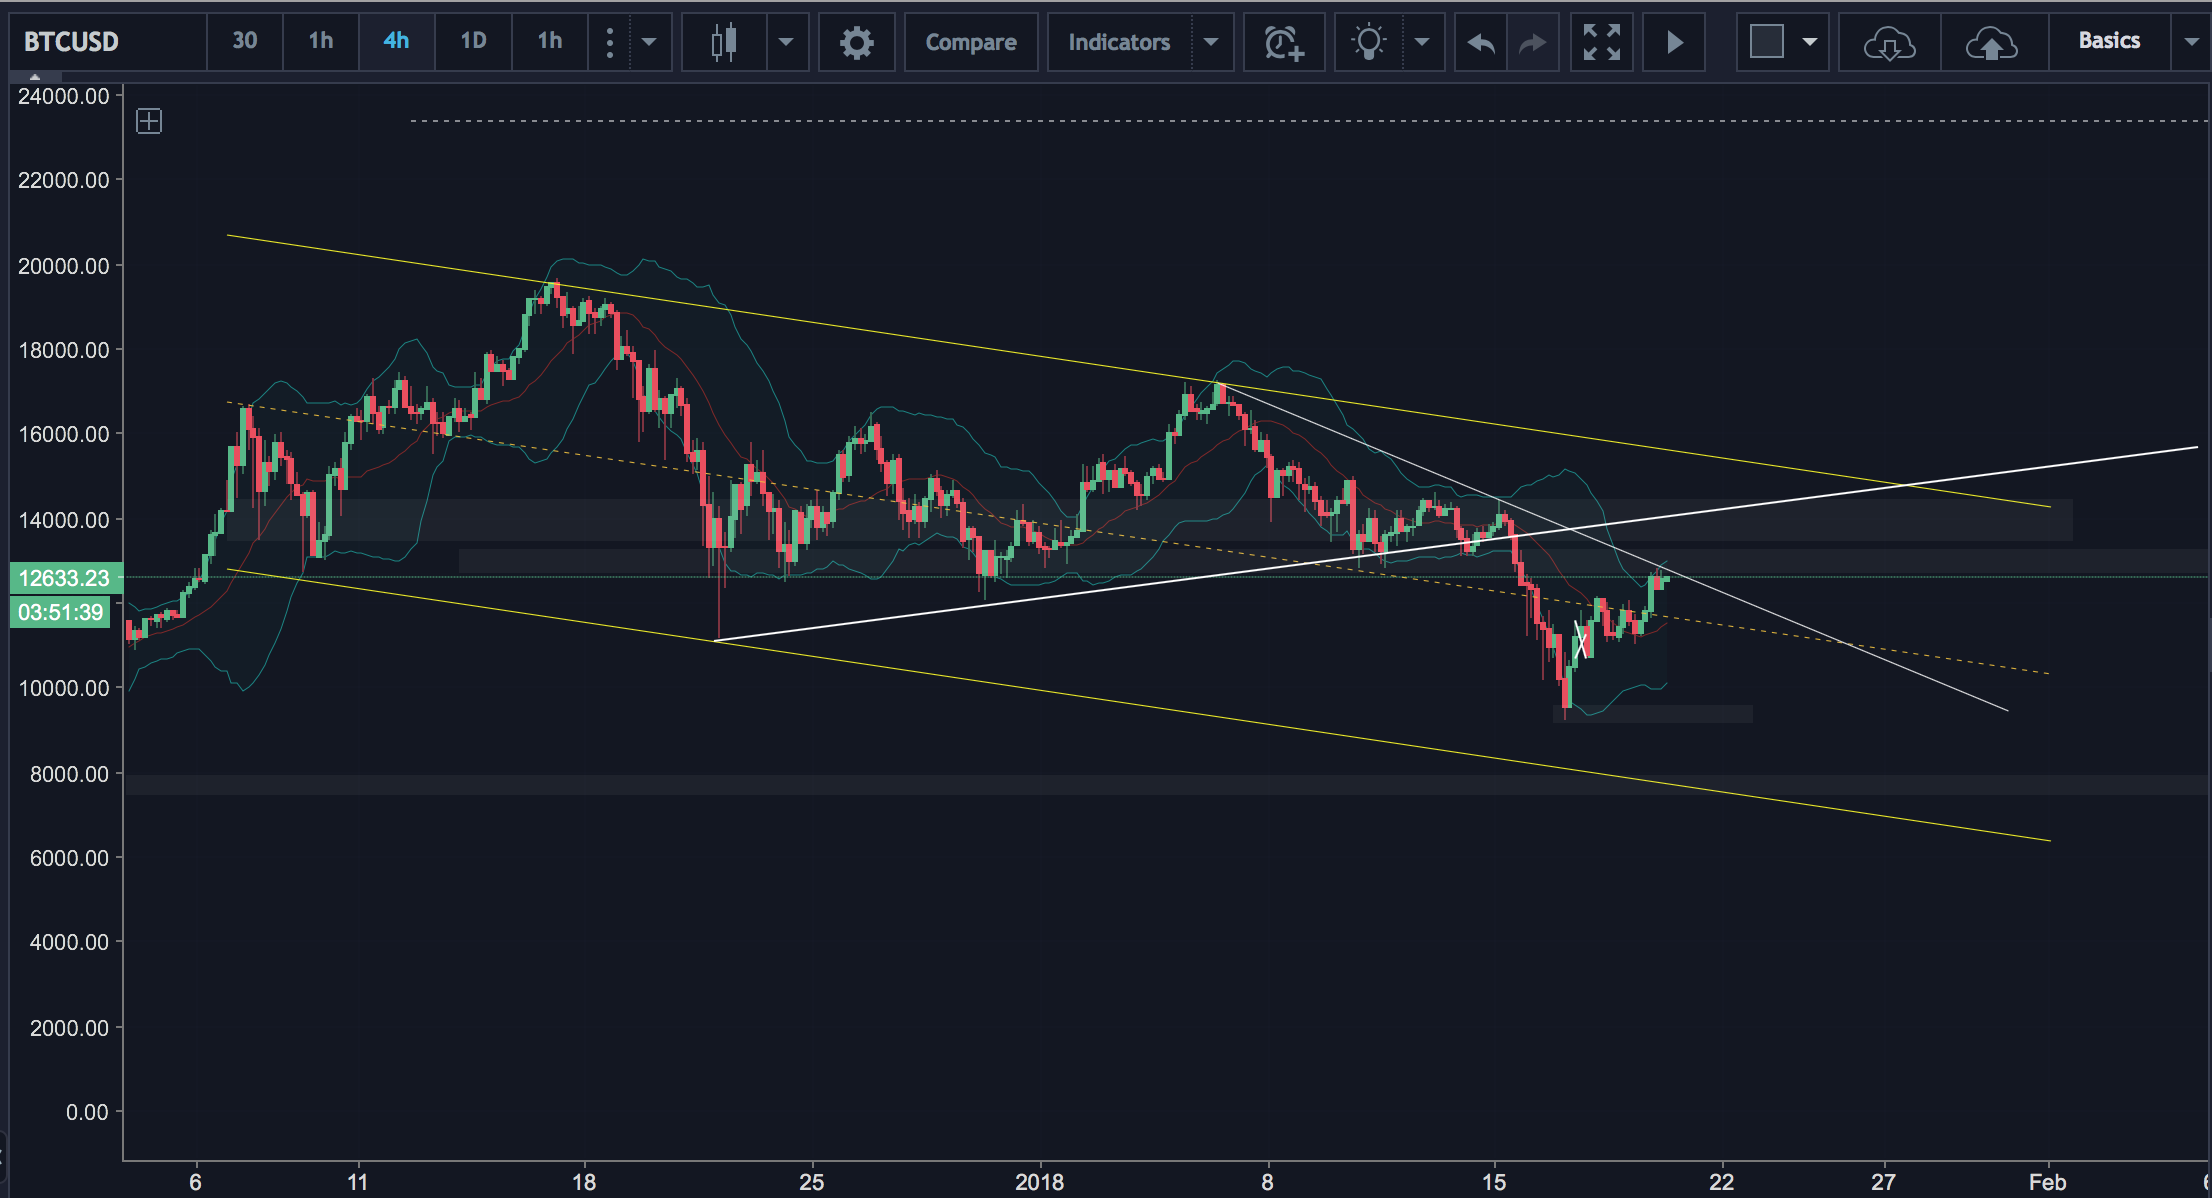
Let's take a look at our current technical chart below.
For those familiar with technical analysis a few things may be immediately obvious.
For one, we are still trading in the downward facing channel that is highlighted by the yellow lines and are currently floating above the "average" of that channel. It's good to note that until we break this channel on either side we are not truly bullish nor bearish; even though the channels main direction is down.
The main key factor that I am looking at with bitcoin is whether or not this demand off the low at $9800-$9900 is sustainable or just a cat bounce that is headed back towards the distribution (range we broke down from) for a simple retest.
The price point I am watching the closest is at or around $13,800 - $14,000. This is also where you see the marked resistance zone (the rectangle) and the backside of the upward facing trend line. Typically, in a true distribution cycle prices fall out of the range and then come back to retest to confirm that the supply is to large and demand can not sustain itself.
Price has, for the moment, started to stall on this pretty steep trend line, which I do believe will break given some time. Once we break this trend I see prices coming to the exact zone we are looking at.
I will be watching as prices near the $14,000 zone and attempt to produce one of the first new highs that bitcoin will (potentially) see in since the sell off.
It is my belief that a rejection of this zone, met with significant sell volume can trigger further downside. Although, a retest of the top of the channel still remains a valid possibility as well.
The "FUD" and news has seemingly stopped pouring in, which is why we may be seeing this leg up for the time being. The only news and major event that I am watching to help the case for another leg down is the expiration of CME futures that happens on the 31st of January, in just under 2 weeks.
It is highly believed that the CBOE futures expiration is what caused the recent leg down, so it is very possible we see a repeat of this coming into the end of January.
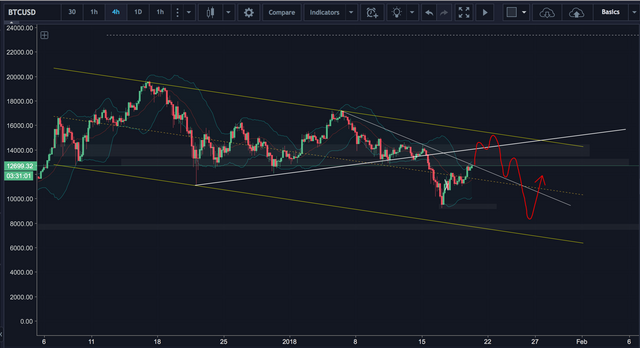
If I was a market maker, and in a perfect scenario, this would play out like I have drawn below. Keep in mind this is just an idea and should not be taken as anything else.
Of course, if we break and hold above this channel, I would throw out any idea of bitcoin coming back down to the lows, at least based off the data that we have today.
But I do believe that some potential selling is still in play, and this could be one of the first distribution cycles on Bitcoin that can play out since it has started its insane bull run in 2016.
Leave your ideas, comments, and thoughts below. Do you see another leg down coming in, or is the market going to brush everything off and return to its rocket up towards $20,000+?
Let me know below. See you guys on the next major update.


Good stuff 👌🏼🙌🏼
Thank you!
ESTE SERIA MI ANÁLISIS Y PREVISIÓN PARA 2018 https://steemit.com/btc/@kaalmaa/analisis-bitcoin-btc-previsiones-2018
ME PODRÍAS DAR TU OPINIÓN? GRACIAS
top notch :)