Ethereum Technical Analysis : Bullish with major Resistance at $320
Hope you guys made huge profit taking long position on $280 - $310 range yesterday ETH TA of double bottom trend reversal :)
ETH/USD is bullish according to ichimoku on hourly price chart, as price is above the cloud and conversion line (blue) is above the base line (red). Also lagging span went above cloud with RSI level above 50 => All indicating bullish nature
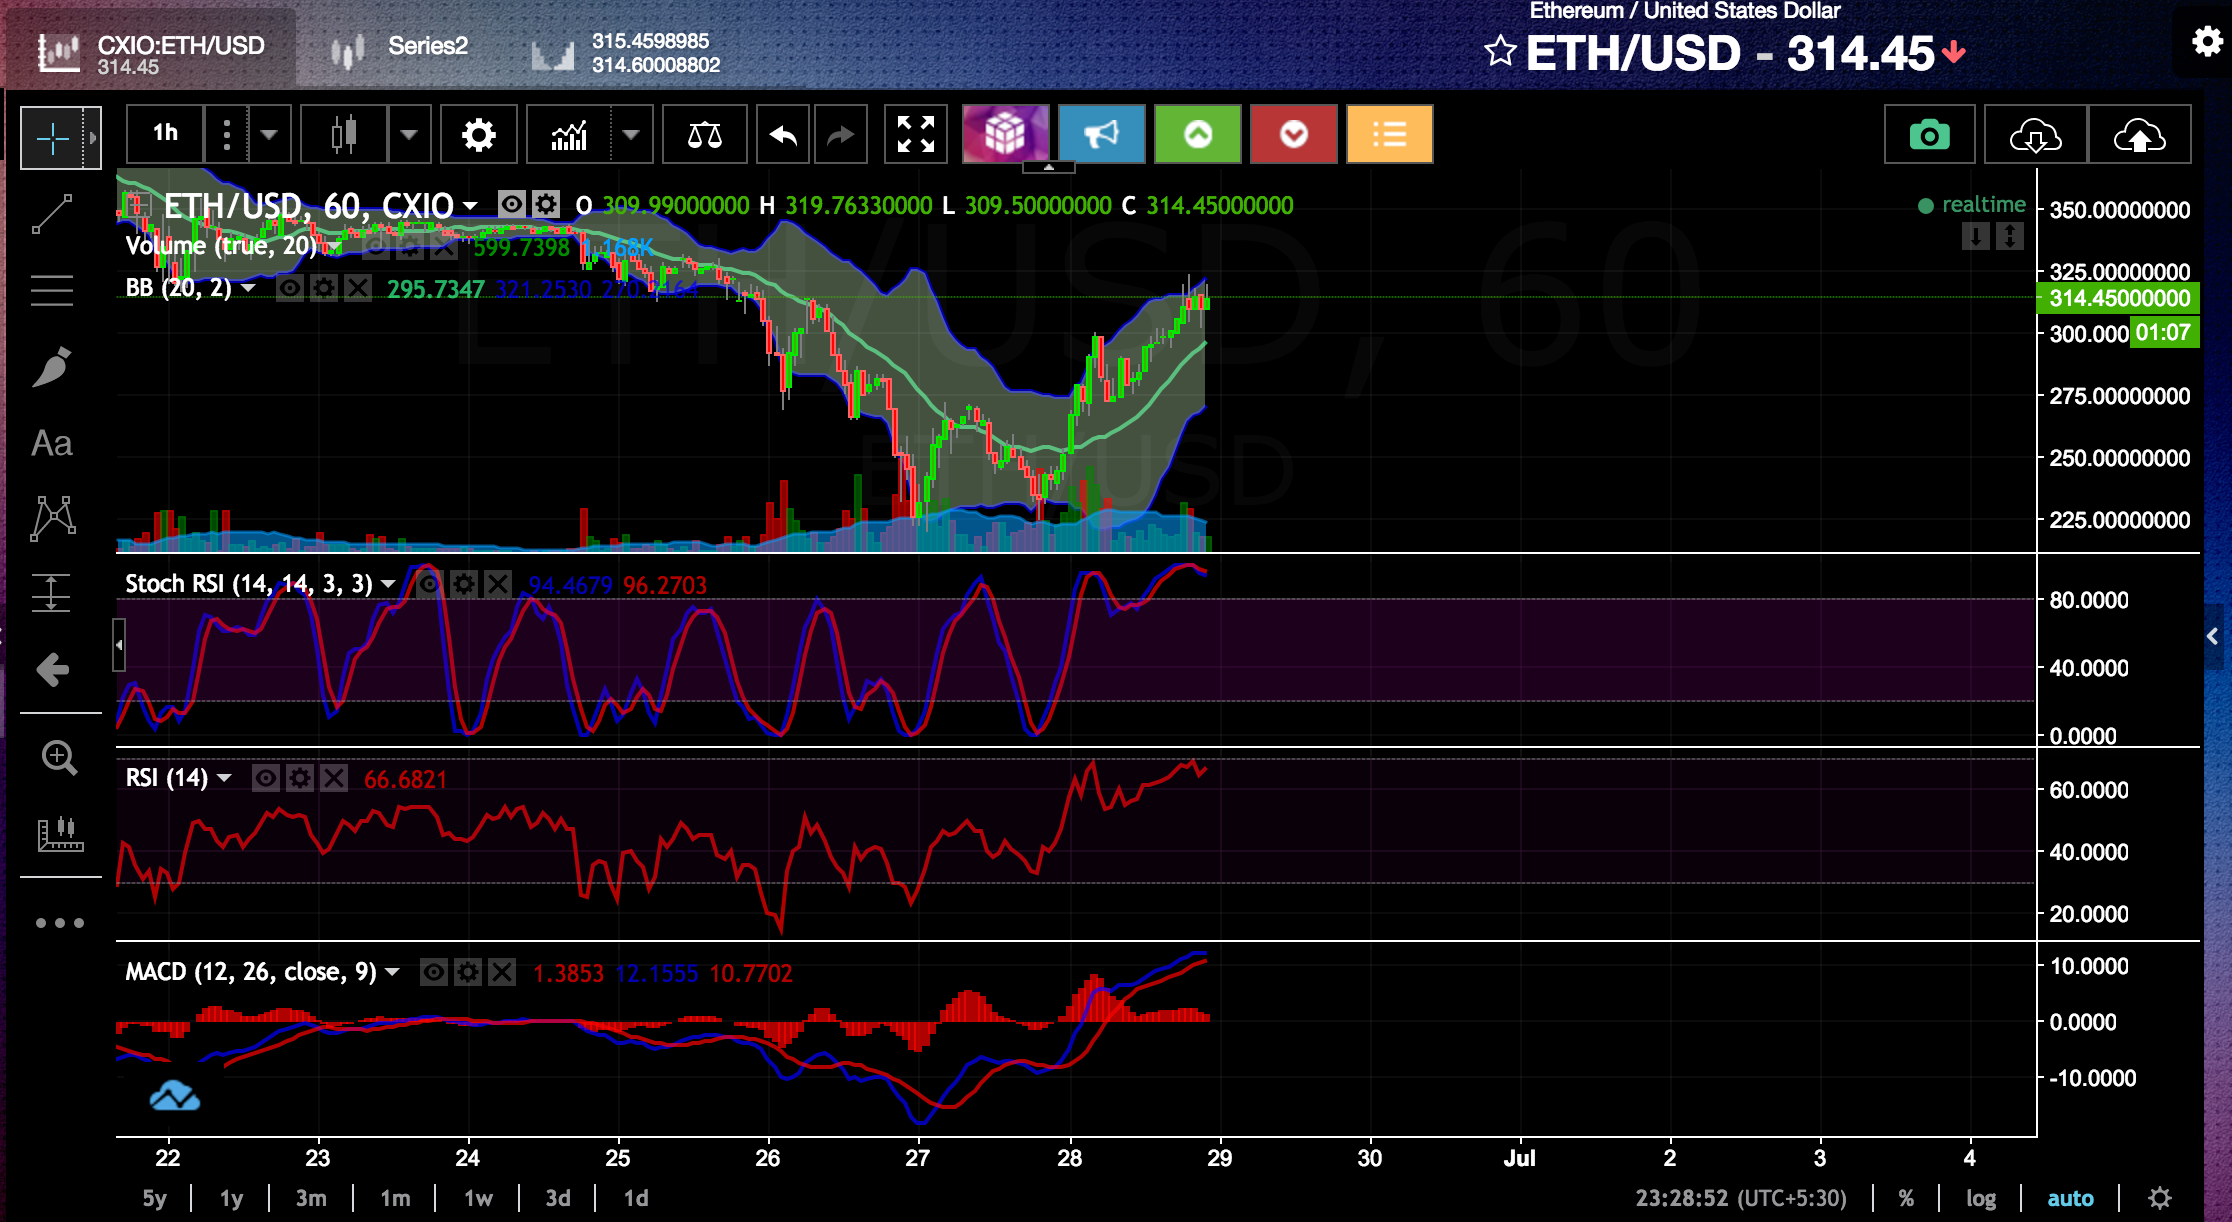
Hourly price chart of ETH/USD on CEX.IO :

Ethereum price is accelerating up with many times testing of $320 barrier, See chart below :

As 60% is already recovered according to fibonacci retracement and MACD is in bullish zone,
- Break above $320 will lead to another long position from $322 - $330 range.
- Break above $330 will lead to long position from $330 - $355 range.
- Further break above $360, will lead to long position from $360- $380 range.
As I have already discussed in one the previous posts, you guys can play around bollinger band and MACD with RSI to LONG/SHORT as price will keep oscillating till the breakout happen on 15-min and 30-min price chart, Although this swing trading will result in small profits.
Keep Trading guys :)