Ethereum Technical Analysis : Trend Reversal (Double Bottom)
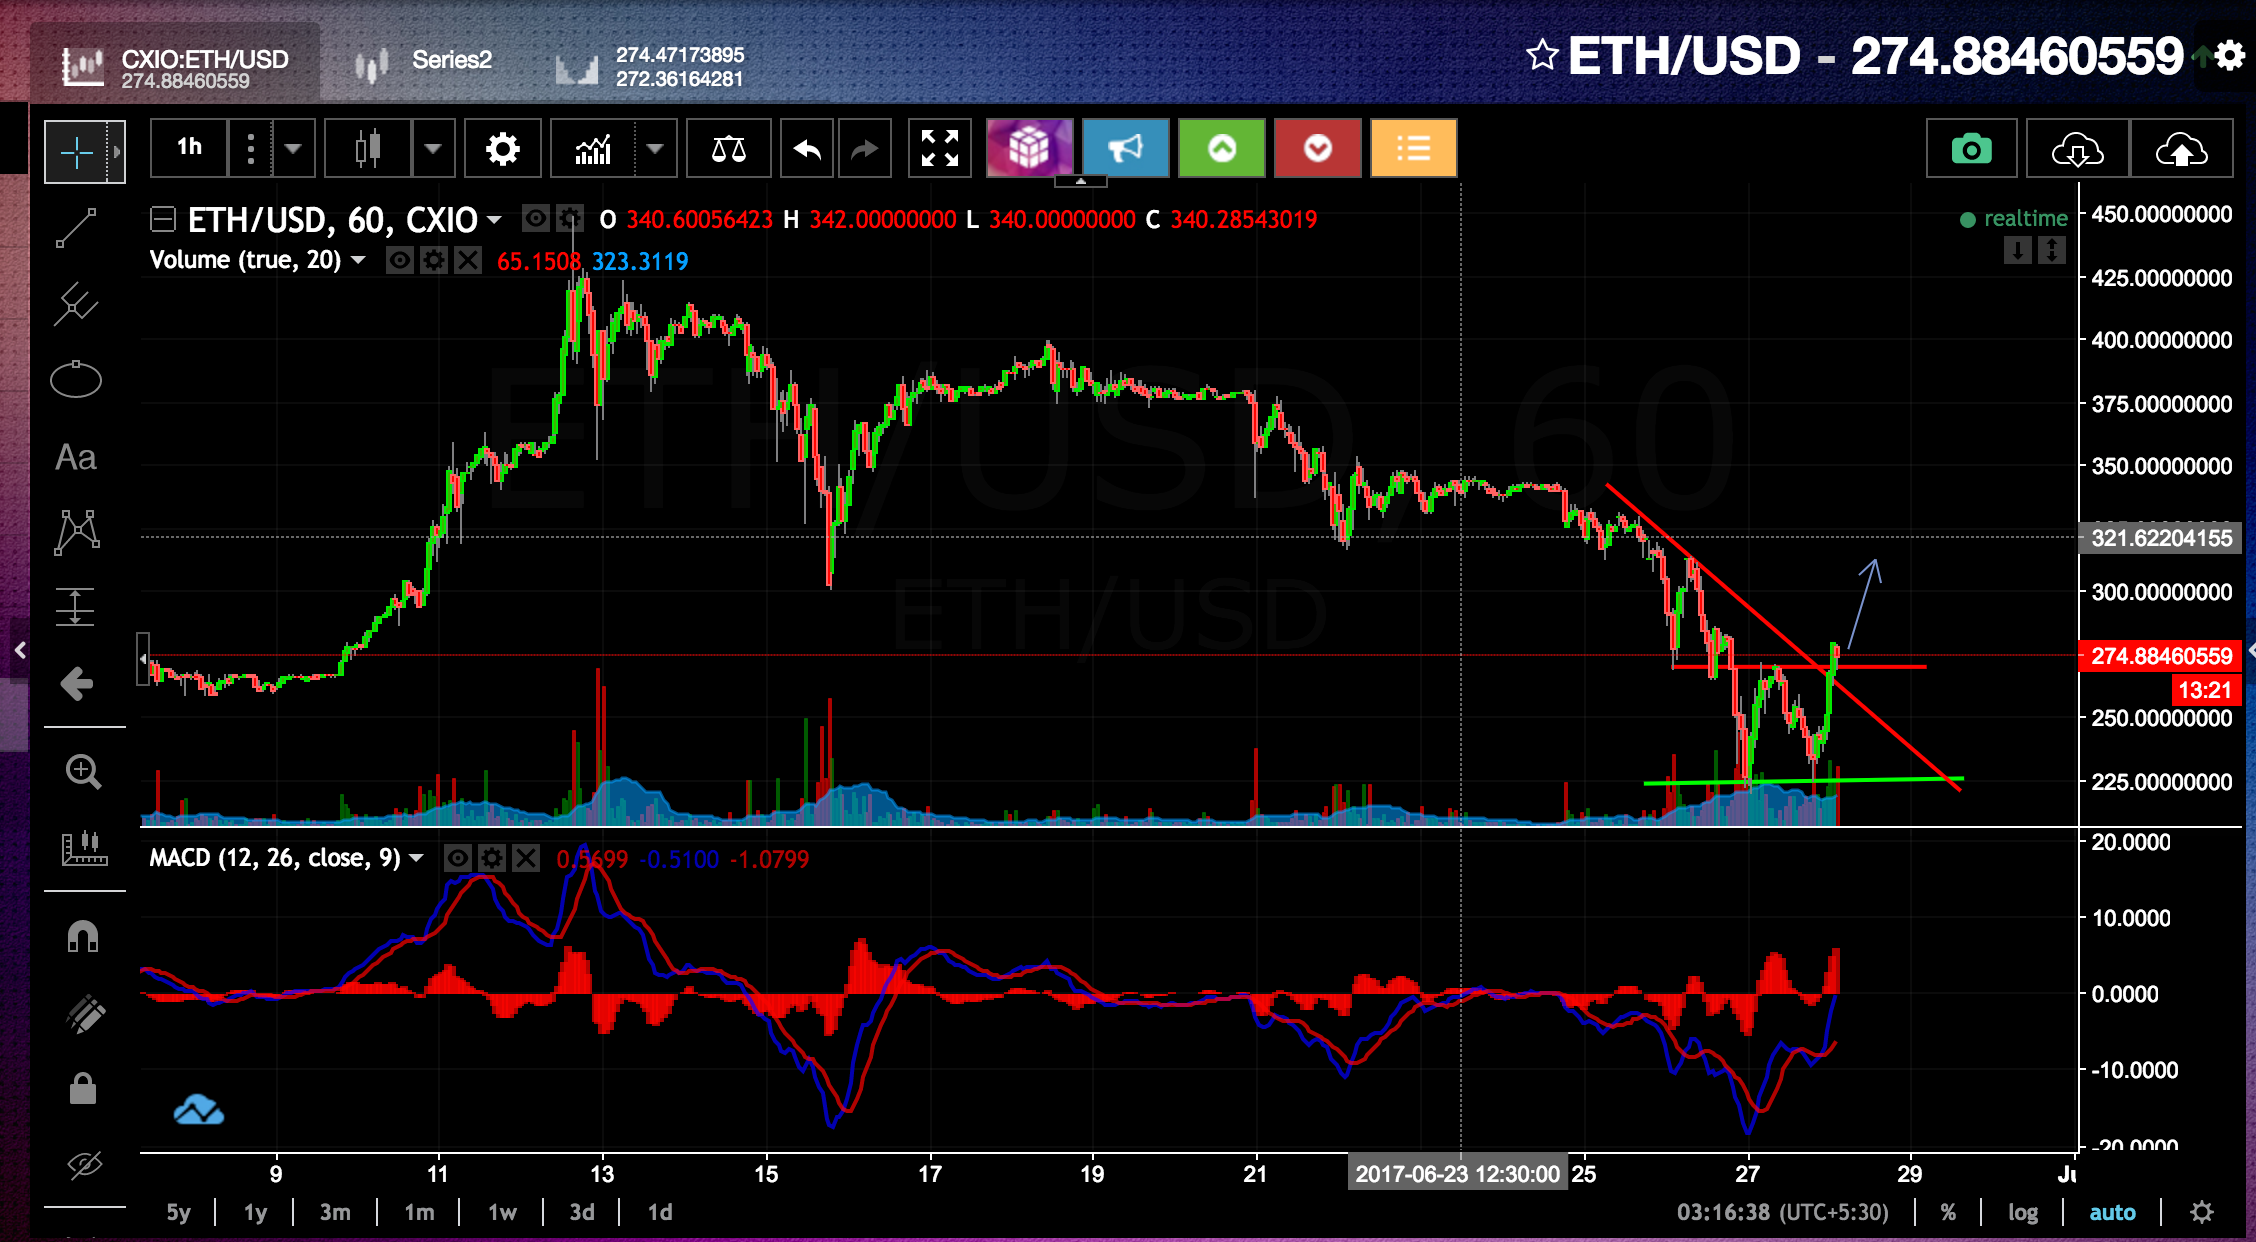
Double Bottom Reversal Pattern can be visualized on ETH/USD pair on CEX.IO, Price chart :

Conditions Satisfied :
- Prior Trend - There should be a bearish pattern upto first Trough
- First trough should be the lowest point of the bearish trend
- High of the peak rounded indicating hesitation to go back down
- Second Trough : Support from the previous low should be expected
- Volume is more important for the Double Bottom Reversal : Volume and buying pressure are accelerating during the advance off of the second trough
- Breaking resistance from the highest point between the troughs, Broken resistance becomes potential support.
So, IMO this could be the probable reversal of the trend, RSI level is above 50 but on hourly chart MACD is still in bearish zone, Once MACD goes in bullish zone, this will confirm the trend reversal.
Also wait for confirmation from ichimoku, when price break the resistance of the cloud on hourly-chart

Great analysis! I hope you are right! I'll follow you for more of this kinds of analysis! I love it! Keep up the good work!
Thanx man :)