A brief history of ultrasound elastography - Part 2
Welcome to the second part of this small series about ultrasound elastography. Last time we learned about Vibration elastography imaging. Today, I would like to introduced Compression elastography and Vibro-Acoustic spectroscopy. As usual, feel free to ask any question in the comment section below.
Compression elastography (1991)
Compression Elastography (a.k.a Quasistatic Elastography or Strain Imaging) is a technique which measures the displacement induced by external forces and attempts to recreate elastographic information by comparing successive B-scans of the same region of interest (ROI). It was invented in 1991 [1]. The idea behind compression elastography is to identify certain areas of relative stiffness by calculating the strain (i.e. the displacement derivative) induced by an external ultrasonic transducer. This method produces images of relative strain which are simple to interpret as long as the applied stress is relatively uniform [2]. Another advantage of this method is that the ultrasound transducer can be used to produce a localized compression near the ROI.
Drawbacks of this method include the requirement of nearly uniform strains in order to enable interpretation of the image, the tendency of objects to move out-of-plane during compression and the difficulty of compressing organs lying deeper in the body [2]. The results are very user-dependent as the induced strain is not uniform for different users. This might lead to a clinical scenario in which different physicians induce different amounts of force on the ultrasonic transducer resulting in different strain images for the same examined region in the same patient. Commercial solutions using this technology are known from the companies Hitachi [3], Siemens [4] and Ultrasonix [5].
Vibro-Acoustic spectroscopy (1998)
The energy transfer of a propagating ultrasound beam in an absorbing medium produces the so-called radiation force which is proportional to local intensity and absorption [6]. In 1990, the measurement of the resulting displacements from a focused acoustic radiation force ultrasound beam has been performed for the first time by applying the radiation force to a tissue sample [7]. This force induces a deformation in the examined tissue which is then measured by a pulse-echo method as a function of time. The relaxation curve of internal stress accompanied with deformation describes the tissue hardness. Also the decay of deformation in the soft tissue measured just after switching of the external force can be an indicator of tissue stiffness [7].
The year 1998 saw the advent of a new method called Vibro-Acoustic Spectroscopy [8] which is also based on radiation force measurements. This method relies on the emittance of "acoustic energy" from solids and tissues in response to an oscillatory radiation force produced by interfering focused beams of ultrasound. Tracking the spatial propagation of this radiation force and recording the amplitude and phase of the emitted sound waves results in data from which images related to the elastic compositions of the acoustically emitting objects can be computed. The technique has been applied to a variety of targets including vessels, phantoms, lesions and contrast agents. The figure below shows that this technique can, for example, be used to visualize calcifications in human iliac arteries giving results superseding X-ray examinations for this particular medical use case.
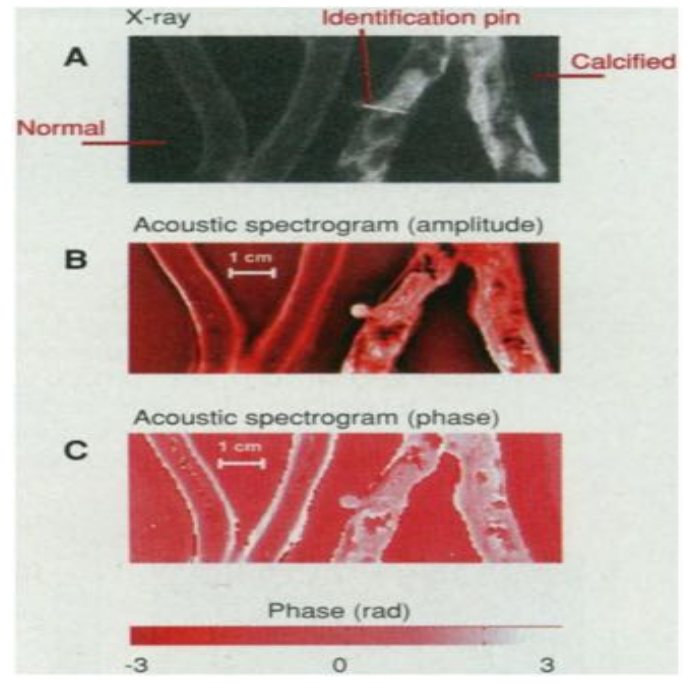
X-ray image of normal (left) and calcified (right) excised human iliac arteries (A), Vibro-acoustic spectrogram amplitude image at a fixed difference frequency of 6 kHz showing calcifications as bright areas (B) and reference phase image (C). Source: [8]
One advantage of Vibro-Acoustic Spectroscopy is its comparatively high sensitivity for displacements. In experiments, object motions on the order of nanometers could be detected [8]. Additionally, this technology is very sensitive to depicting calcifications in soft tissue [9], as the figure above suggests. Drawbacks of this method include the high likelihood of imaging artefacts, such as standing waves because of the long ultrasound transmissions and acoustic reverberation effects and the fact that only a few in vivo studies have been performed so far [9].
Thank you once again very much for your attention. You might have noticed that we still haven't met Papa Smurf as promised in the last article. Stay tuned, maybe we'll get to know him better in the next part.
References
- J. Ophir et al. “Elastography: A quantitative method for imaging the elasticity of biological tissues”. In: Ultrasonic Imaging 13.2 (1991), pp. 111 –134. ISSN : 0161-7346.
- K J Parker, M M Doyley, and D J Rubens. “Imaging the elastic properties of tissue: the 20 year perspective”. In: Physics in Medicine and Biology 56.1 (2011), R1.
- Hitachi. Real-time Tissue Elastography (RTE).
- Siemens. syngo Velocity Vector Imaging technology.
- Ultrasonix. (http://www.ultrasonix.com/node/295)
- G. R. Torr. “The acoustic radiation force”. In: American Journal of Physics 52.5 (1984), pp. 402–408.
- T. Sugimoto, S. Ueha, and K. Itoh. “Tissue hardness measurement using the radiation force of focused ultrasound”. In: Ultrasonics Symposium, 1990. Proceedings., IEEE 1990.
- Mostafa Fatemi and James F Greenleaf. “Ultrasound-stimulated vibro-acoustic spectrography”. In: Science 280.5360 (1998), pp. 82–85.
- Matthew W Urban et al. “A review of vibro-acoustography and its applications in medicine”. In: Current medical imaging reviews 7.4 (2011), pp. 350–359.
Can I ask in which field you are working? It seems like you are some kind of chemist (Chemiker)
Hello @aircoin. Thanks a lot for your comment. I'm not a chemist at all. I'm actually a computer scientist and don't know
muchanything about chemistry. I'm currently just working in the field of ultrasonography and thus have to teach myself quite a lot of physics.Very interesting but also quite challenging with my background. What about you? Are you a computer scientist as well?
Thanks for sharing.... But some more images would have helped me better in understanding.... :)
Thanks a lot for your feedback. I'll have some more images in part 3. Please let me know if you have any questions.