The Only Guide To Technical Analysis That You Will Ever Need
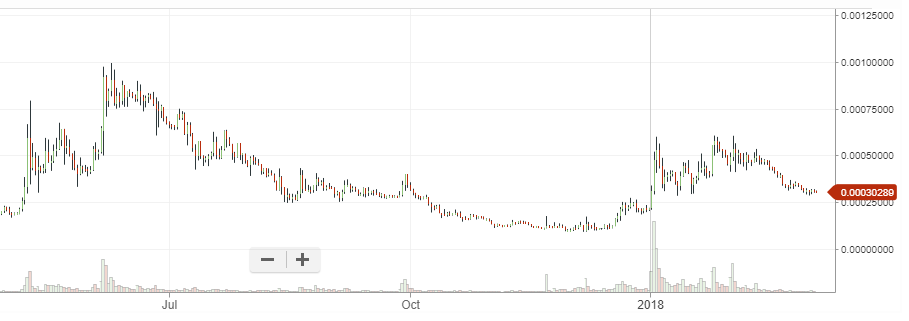
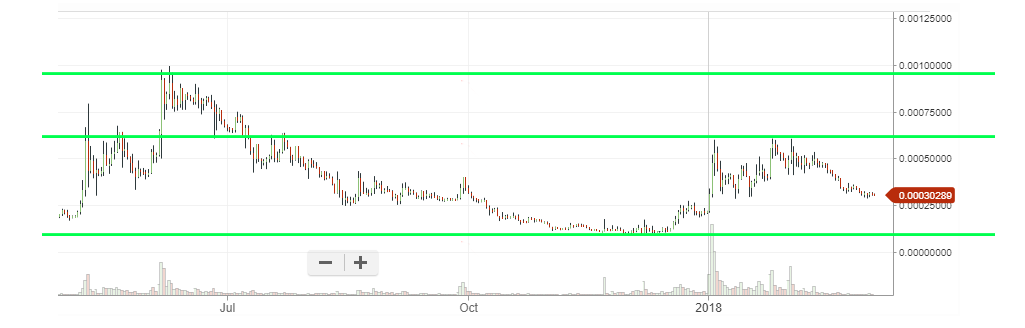
Charts are historical price ranges, got it? Short or long-term, your choice. Take for example, BTC-Steem's daychart:-
Okay, Bob. Now draw a line now across the chart. But what line, you ask? Just draw something. Try it!
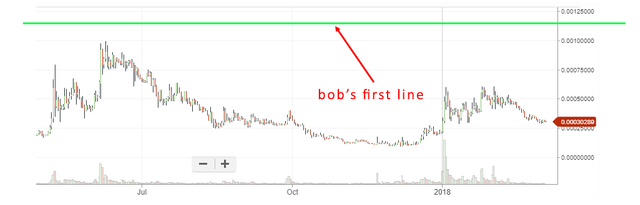
Okay, Bob. Nice line. But why did you draw it there? Try again. Make some sense into your damn line.
Nice, Bob. Now you're getting somewhere. You just drew your line at the highest price point of BTC-Steem over the period of about nine months. I'm proud of you!
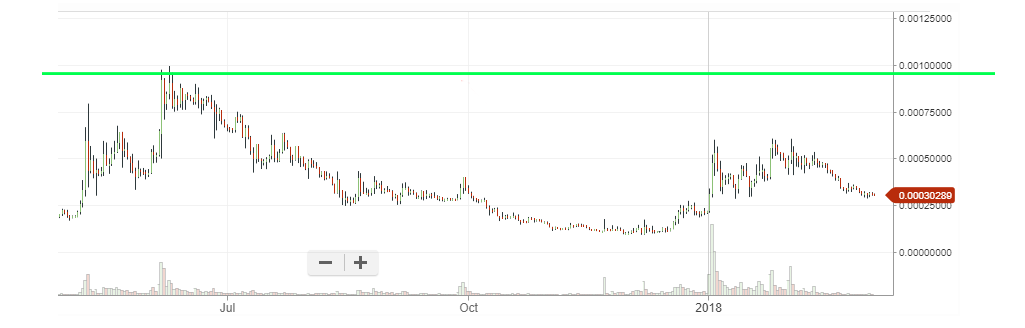
What? You're not sure if you should draw it at 0.000985, 0.000989, 0.000999, 0.00100, or 0.00111 instead of the line you have at 0.000975 now? Look, I'm not a scientist and quantum mathemagician. It's up to your taste in lines. Now Bob, what's the opposite of highest? Draw your next line.
Splendid, Bob. You see, if enough people believe in these lines, you can expect prices to have good chances to react when price reaches these lines. It's best to think of these lines as sponges. Because not everyone draws the exact same lines.
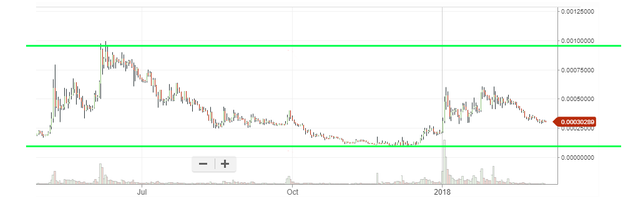
Now, try to draw a line somewhere in the middle. Use some common sense.
Amazing, Bob! You've connected some nice dots. Let me show you.
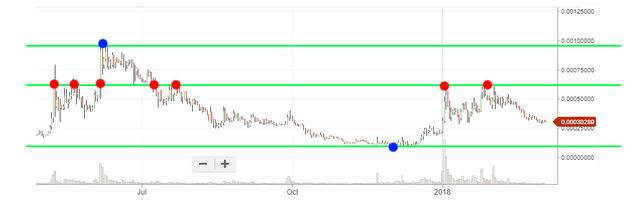
The blue dots just indicate the maximum and minimum price points, hence they're not connecting any dots (although they might). Now, the red dots are the local-maximums and / or local-minimums. You've connected quite a few, so that's great. You're quickly becoming a great line drawer, Bob.
Try another one.
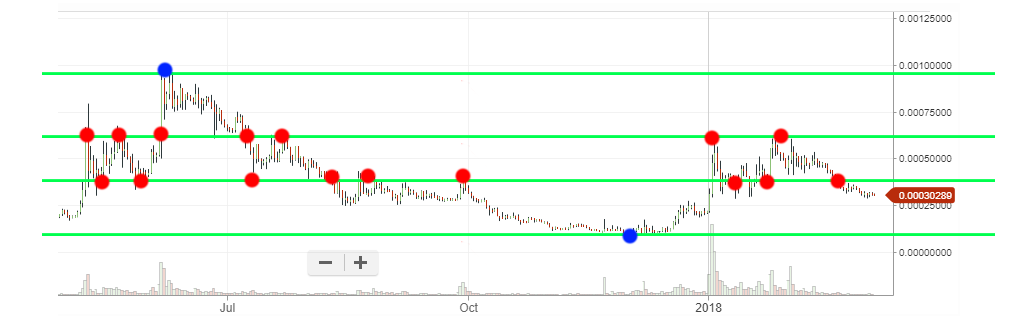
Phenomenal, Bob. Maybe I should call you master Bob soon. What? You're not so sure about the new line since there are sticks jutting out and doesn't look so elegant? Bob.. bob. Remember that the line is a sponge. It's squishy. Don't worry about it. You can draw more lines too if you want, zooming in and out, with different timescales. Even with diagonal lines if you so fancy. But your chart will quickly get cluttered with lines and you'll have to decide whether or not to buy or sell at 0.1, 0.11, 0.111, 0.1111, 0.12, 0.121, 0.12111 or whatever. You get it.
Okay now. If you're desperate and really want to get some Steem right now and profit in the future, these lines are your own guide. Choose a line. Where will you sell?
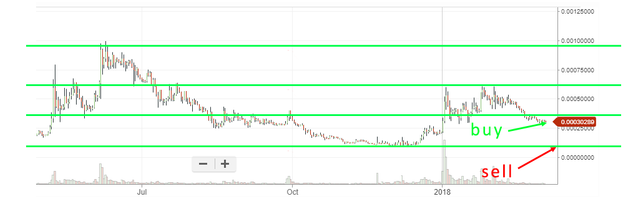
Yes, Bob. That's exactly how you make money. Now give me $200 for the crash course. I won't teach you anymore because that's all you really need for the rest of your life. I'm a simple man. I just buy stuff I believe in and hold long term. No lines needed (well, except to buy low, but why a line again?)
#savetheinternet
#supportcurationworks
#steemsalvation
Am I doing it right?
Is it a good time to buy more?
What do I do!!!
Image produced by me. Not to be taken seriously. Don't do more lines than you can handle. Too many lines could lead to living behind dumpsters. I am not a professional.
No good lines, looks like they can be sniffed up
Lol, i just noticed what it is after seeing ur reply. Oh @nonameslefttouse very poetic
Argh, a good pun of mine got missed then. :(
Don't worry. It's not a photograph of last night's supper. Just some digital art and a stupid joke... LOL
This means you have to go all-in! :P
Good one!....:)...
Those are some quality lines sir. Better than sponges, and easy on the eyes. Sell those lines, and buy more!
Wait for the highs before selling though. ;)
Good one lmao
It's what I do. ;)
ahh the steemit symbol sideways!
What do you think, can Bob make these lines
This is too basic of a graph in my opinion, love the teaching strategy tho.
I like charts for short terms ups and downs.. but still do not understand how to get the most out of reading charts. any good books or videos.. one can recommend.
I do not read too many books but I think this is the best to learn charting: Technical Analysis of Stock Trends by Robert D. Edwards, John Magee, W.H.C. Bassetti. I can't wait to buy this.
Salomondrin and Jon Olsson are making nice videos :D
I listen to podcasts a lot. Do you know Chat With Traders, Bloomberg View, Futures Radio Show or Rob Booker?
Funnily enough I too am a sponge for those lines XD
Ayyy lmao
Me when reading TA on cryptocoins:
Hahahahaha, you would have made quite a good teacher. Maybe you should get a school, I'll should send my kids there (that's when I have one).
Back to the lines and graph and chart. I usually believe that life does not holds any permanent formula. What works for Mr A might not work for Mrs B, so I usually learn all this line and chart then discard them for what I believe will work out. Often times people ask me what I think they should invest in. First I'll run analysis of some market for them, then tell them to do as they wish. Time and chance happens to everything.
School of lines? :D Anyway.. It's just for discipline / decision-making, there's nothing much to TA. It's mass psychology.. i mean if everyone thinks the same, draws the same lines, and makes the same decisions.. but there's just so many different kinds of lines out there.
had to switch hands I wrote so many of them :(
@kevinwong I love keeping things SIMPLE too. Just like Life...it was meant to be that way.
Human beings just love complicating things. And that's another place where opportunities exist. In our challenges. 😊👍🏻
Drawing lines...always tells a story.
Mel @coachmelleow
Awesome tutorial on technical analysis, now I have the skills to predict the future price of Bitcoin!!!!
But seriously, this was super entertaining to read, and the satire is hilarious. It's striking how many people out there claim to be able to predict the markets by drawing a couple of lines, triangles, etc... Although I'm not discounting technical analysis as a legitimate aspect of cryptocurrency trading, the absurdity of some of the stuff out there is unbelieveable!
I sure wish Bob all the best for his future journey with cryptocurrency, he sure needs it!
Cheers, Kevin.
There are many kinds of lines, and horizontal lines are most basic when 99% of people look at charts i think. anything more fancy is just wishful thinking (or profiting from others piling on your popular trend lines). I wish Bob success too!
You forgot to tell Bob that his lines work best on longer time-frames. Anything less than a daily chart becomes more speculative and if he's looking at hourly charts or less the lines don't really work all that great.
Of course Bob jumped right into the markets using tick charts - "I'm gonna be rich next month" - and now he thinks you scammed him out of $200. :D
LOL, next month is pretty long. I think these days is moon-lambo potential within 18 hours, what're you talking about??!
Oh, now we're talking the golden moon-lambo triangle? I don't know if Bob is ready for such an advanced charting technique. I mean there's only technically a 23 minute window when it's really accurate, and he would need to draw all the lambo fan lines, as well as the 15 degrees of mooning.
And then there's the equity investment bag holders ratio (EIBHR) to consider. Do you think Bob is ready for this?
Lol was this seriously peddled out there?
LOL. No, it's my own made up hyperbole :)
lol. Hold on Bob. maybe it's not so black and white. Oh and hey Bob, you might wanna do the opposite with the whole buy and sell bit. There's a big hole of sarcasm in front of ya. lol
I loved the simplicity he put in this post. Even i who doesn't know a thing about TA got a hold on how it works.
@kevinwong's explanation was perfect. Not only for those new to TA, but even for some who've had experience with it, but get caught up in the whole indicators trap. That's where the sarcasm came from. Even an experienced person could benefit from his explanation, because it would prompt them to clear their charts and trade with simple indicators (support/resistance). Simple is often best.
Lol, this is an exceptional explanation in very simple terms. I didnt know that before, didnt know how the "mathemagician" come up with their things... thanks alot. Here is your $200..
Bring the 200 bucks here. Am applying to work as his accountant.
Hilarious. Great lessons comes simplified, unfortunately we only know Bob, the master remains unknown. Regardless, thanks master, lessons well taught and digested, now a NOOB can make a conscious buy and sell decision. I'm off to the exchange market.
BTFD
LOL! We shouldn't just draw lines, it's a combination of lines, trend channel, MA and candle stick patterns like the classic Pin bar at the daily chart.