Sly mathematics. We visualize the multiplication/Хитрая математика. Визуализируем умножение
The Internet travels a curious method of multiplying natural numbers, based on the geometric interpretation of this process. For the first time I stumbled upon it, maybe a year or six months ago, but I was not particularly interested in it. This method seemed to me less effective than traditional multiplication in a column. Although the idea itself attracted, because I like to study the original solutions of well-known problems. And just recently I saw him again, read rave reviews and decided to consider this issue in more detail.
The visualization of multiplication is positioned on the Web as an invention of the Chinese, Japanese and even Aryans. That is, it should be old enough, with an age of about 4000 years (if you admit his authorship for the arias). In addition, Internet users mention that they use it in Chinese schools to this day.
I write down in my helplessness, but I could not find information that would evoke my confidence and confirmed all the above versions. The only mention of the find in Japan of the ancient table of multiplication (namely the table), dated VIII century, did not convince me. This situation seems strange to me, because if this method actually had such ancient roots, then the Internet would not be limited to rewriting about two or three identical texts that contain absolutely no historical information. Although, perhaps, I was just looking bad.
Next, I tried to find confirmation that this method is used in schools in modern China. And this attempt, to my regret, ended unsuccessfully. True, I learned a lot of interesting things about the Chinese method of teaching mathematics and the high results of this technique. But not a word about the visualization of multiplication. I got the impression that if you tell a Chinese about him, then in response you can get complete perplexity)))
По просторам Интернета путешествует любопытный метод умножения натуральных чисел, основанный на геометрической интерпретации этого процесса. Впервые я наткнулся на него, возможно, год или полгода назад, но особо не заинтересовался, т.к. этот способ показался мне менее эффективным, чем традиционное умножение в столбик. Хотя сама идея привлекла, поскольку люблю изучать оригинальные решения общеизвестных задач. И вот недавно увидел его опять, почитал восторженные отзывы и решил рассмотреть данный вопрос подробнее.
Визуализация умножения позиционируется в Сети как изобретение китайцев, японцев и даже ариев. То есть он должен быть достаточно древним, с возрастом примерно в 4000 лет (если допустить его авторство за ариями). Кроме того, пользователи Интернета упоминают о том, что им пользуются в китайских школах и по сей день.
Расписываюсь в своей беспомощности, но я не смог найти информации, которая вызывала бы моё доверие и подтверждала все вышеизложенные версии. Единственное упоминание о находке в Японии древней таблицы умножения (именно таблицы), датированной VIII веком, меня не убедило. Данная ситуация для меня представляется странной, поскольку если бы этот способ на самом деле имел бы такие древние корни, то Интернет не ограничился бы переписыванием примерно двух-трёх одинаковых текстов, не содержащих абсолютно никакой исторической информации. Хотя, возможно, я просто плохо искал.
Далее я попытался найти подтверждение тому, что этот способ используется в школах современного Китая. И эта попытка, к моему сожалению, закончилась неудачно. Правда, я узнал много интересного о китайской методике преподавания математики и высоких результатах этой методики. Но ни слова о визуализации умножения. У меня сложилось впечатление, что, если рассказать какому-нибудь китайцу о нём, то в ответ можно получить полнейшее недоумение )))

Nevertheless, the graphical representation of the multiplication itself is original enough, it causes interest and it is quite easy to understand it. To multiply into a column, you need to know the multiplication table and perform some calculations in the mind. In the graphical version, the knowledge of the multiplication table is not mandatory (which, incidentally, is what many users who admire this method emphasize). So, what is its essence?
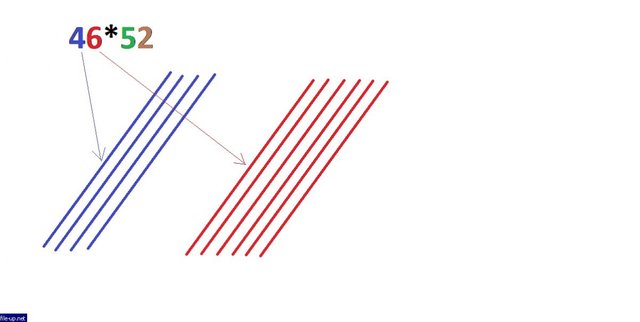
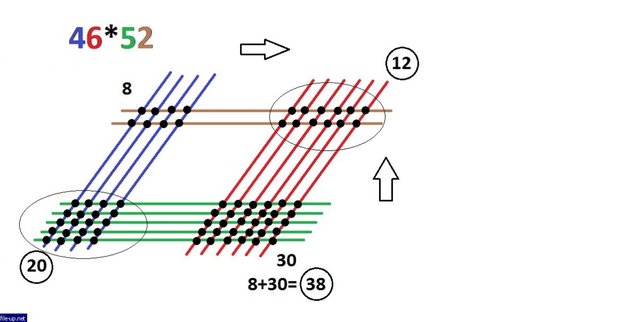
Let's say that we decided to multiply two numbers: 46 and 52. Let's represent each digit of the record of number 46 in the form of a corresponding number of vertical lines:
Тем не менее, графическое представление умножения само по себе достаточно оригинально, вызывает интерес и разобраться в нём достаточно просто. Для умножения в столбик необходимо знать таблицу умножения и производить некоторые вычисления в уме. В графическом варианте знание таблицы умножения не является обязательным (на что, кстати, делают упор многие пользователи, восхищающиеся данным методом). Итак, в чём же его суть?
Допустим, что мы решили перемножить два числа: 46 и 52. Представим каждую цифру записи числа 46 в виде соответствующего количества вертикальных линий:
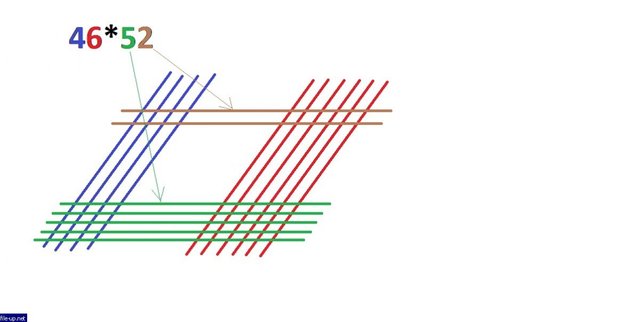
Similarly we enter with the number 52, only the lines will be horizontal:
Аналогично поступаем с числом 52, только линии будут горизонтальными:
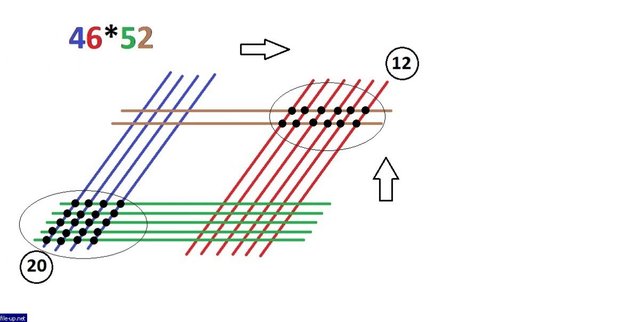
As a result, we get a finite set of intersection points of all these lines, which for certainty I will call "nodes", and the interpretation of the number of which, in the end, will give an answer. If we adhere to the order of the lines proposed by me (they are shown by arrows for each of the numbers), then the first group of nodes that we need to calculate is in the upper right corner. There are 12:
В результате мы получаем конечное множество точек пересечения всех этих линий, которые для определённости я буду называть "узлами", и интерпретация количества которых, в конечном счёте, и даст ответ. Если придерживаться порядка линий, предложенных мною (они показаны стрелками для каждого из чисел), то первая группа узлов, которую нам надо просчитать, находится в правом верхнем углу. Их - 12:

Similarly, consider the number of nodes in the opposite corner, they are 20:
Точно также считаем количество узлов в противоположном углу, их - 20:
Now we count the number of all remaining nodes in the left upper and lower right corners. In total they are 38:
Теперь подсчитываем количество всех оставшихся узлов в левом верхнем и правом нижнем углах. В сумме их получается 38:
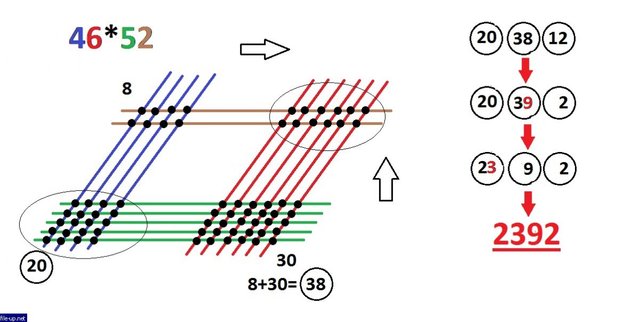
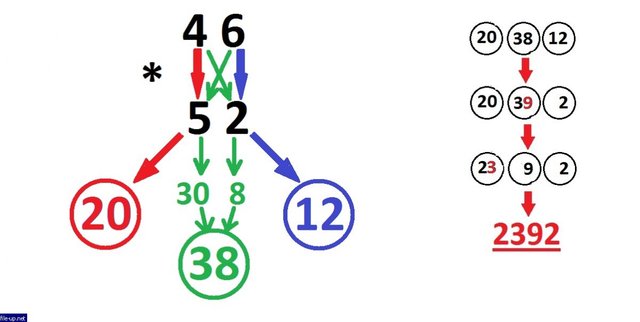
This completes the role of visualization. Write out the three numbers obtained one after the other from left to right in the order they are in the figure: 20, 38, 12 and start working with them in reverse order - from right to left. In this case, we apply the following rule: if a double-digit number is obtained in the circle, then the digit of the highest digit is added to the digit of the number in the previous circle. That is, from 12 there are only 2, and the unit is added to 38, making 39 out of it. Then from 39 there are only 9, and the triple is added to 20 and it turns out 23. The last number remains in the form 23. Everything, the answer is 2392:
На этом роль визуализации заканчивается. Выписываем полученные три числа друг за другом слева направо в том порядке как они располагаются на рисунке: 20, 38, 12 и начинаем работу с ними в обратном порядке - справа налево. При этом применяем следующее правило: если в кружочке получается двузначное число, то цифру старшего разряда прибавляем к разряду единиц числа в предыдущем кружочке. То есть от 12 остаётся только 2, а единица добавляется к 38, делая из него 39. Затем от 39 остаётся только 9, а тройка прибавляется к 20 и получается 23. Последнее число так и остаётся в виде 23. Всё, ответ - 2392:
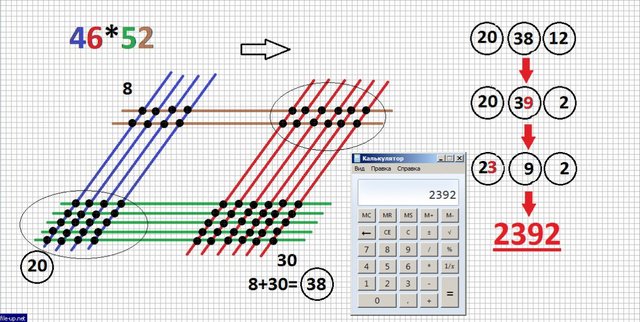
We check on the calculator - bingo!
Проверяем на калькуляторе - бинго!
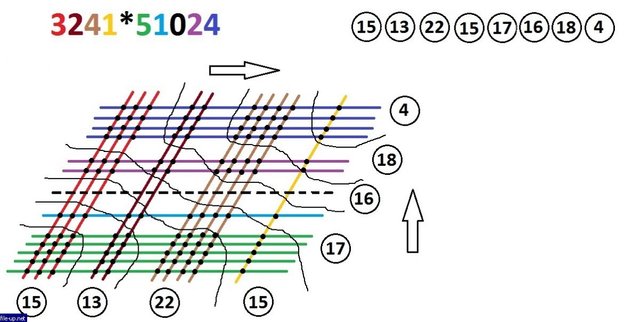
The question arises - what if there is a digit 0 in one of the digits? In this case, we interpret it not as a solid line, but as a dashed line, and we do not consider the nodes resulting from the intersection of other full lines with it. I will consider this case on a more complex example: 3241 * 51024. Draw lines, use arrows to specify the direction of decreasing numbers:
Возникает вопрос - как быть, если в каком-то из разрядов стоит цифра 0? В этом случае мы интерпретируем её не сплошной, а пунктирной линией, и узлы, получающиеся в результате пересечения с ней других полноценных линий, не считаем. Рассмотрю этот случай на более сложном примере: 3241х51024. Рисуем линии, задаём стрелками направление уменьшения разрядов чисел:
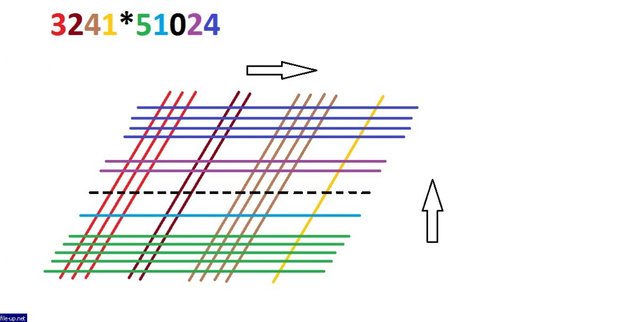
Then, in my opinion, the most difficult moment of visualization. We need to properly divide the picture into sectors. We adhere to the following algorithm: we separate the right upper and lower left corners (this is the easiest), and then, starting from them, gently "bite off" the new sectors in the direction to the center, each time increasing the number of groups of nodes per unit. Easier to show))):
Затем, на мой взгляд, самый сложный момент визуализации. Нам необходимо правильно разбить рисунок на секторы. Придерживаемся следующего алгоритма: отделяем правый верхний и левый нижний углы (это проще всего), а затем, отталкиваясь от них, аккуратно "откусываем" новые секторы в направлении к центру, каждый раз увеличивая количество групп узлов на единицу. Проще показать ))) :
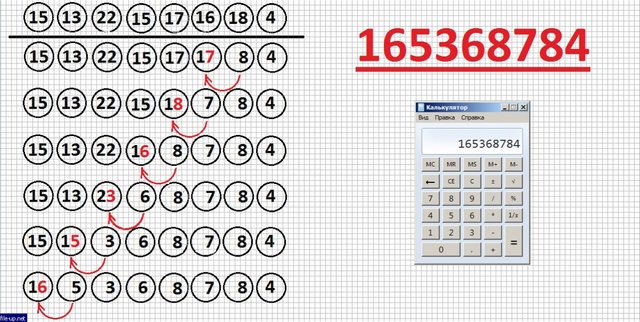
We calculate the necessary sums and write out the resulting series of numbers:
Просчитываем необходимые суммы и выписываем получающийся ряд чисел:
It remains to do with them the simple transformations described above and check the answer with the help of the calculator:
Осталось проделать с ними нехитрые преобразования, описанные выше и проверить ответ с помощью калькулятора:
You can see that the visualization stage is needed only to obtain reference numbers, in the following the figure does not bear any semantic load. In the case of multiplication of two-digit numbers, one can easily imagine this visualization in the form of multiplying (in a certain way) the digits of the data of numbers:
Можно заметить, что этап визуализации нам нужен исключительно для получения опорных чисел, в дальнейшем рисунок не несёт никакой смысловой нагрузки. В случаем перемножения двузначных чисел, можно легко представить эту визуализацию в виде перемножения (определённым образом) цифр записи данных чисел:
In the case of multivalued numbers, such a substitution seems so confusing that I stopped writing it on paper.
Having mastered this method, I still decided to test its effectiveness. For the purity of the experiment, he asked me to help my wife in this, suggesting that she multiply the control numbers by the speed. She had long been accustomed to the fact that her husband was crazy, so she did not even ask why I needed it. Just asked to give the opportunity to practice a little, because at her work the data from her is cheated by the computer, and she only tells him how to do it. I took the other examples: 73x45 and 3542x45132.
Results: the first example "in a column" - 20 seconds, "graphically" - 52 seconds; the second example "in a column" - 1 minute 21 seconds, "graphically" - 3 minutes 20 seconds. And this is in view of the fact that I cheated and instead of directly counting the nodes I got their numbers using multiplication in my mind, which, naturally, significantly reduced the time spent. And if in the numbers there were only the highest digits? How many lines would I have to draw then?
Therefore, my children, you learn the multiplication table, it is simpler and more understandable. Although the "Chinese" way can be useful to you, if you want to surprise someone.
And remember that knowledge is power!
В случаем с многозначными числами подобная замена представляется настолько запутанной, что я бросил её рисовать ещё на бумаге.
Освоив этот метод, я всё-таки решил проверить его эффективность. Для чистоты эксперимента попросил помочь мне в этом жену, предложив ей на скорость умножить в столбик контрольные числа. Она давно уже привыкла к тому, что муж у неё - сумасшедший, поэтому даже не стала спрашивать, зачем мне это надо. Просто попросила дать возможность немного потренироваться, поскольку на своей работе данные у неё обсчитывает компьютер, а она только указывает ему, как это делать. Примеры я взял другие: 73х45 и 3542х45132.
Результаты: первый пример "в столбик" - 20 секунд, "графически" - 52 секунды; второй пример "в столбик" - 1 минута 21 секунда, "графически" - 3 минуты 20 секунд. И это с учётом того, что я жульничал и вместо прямого подсчёта узлов получал их количества, используя умножение в уме, чем, естественно, существенно уменьшил затраченное время. А если бы в числах были только старшие цифры? Сколько бы линий мне пришлось рисовать тогда?
Поэтому, дети мои, учите таблицу умножения, оно и проще, и понятнее. Хотя и "китайский" способ вам может пригодиться, если вы захотите кого-нибудь удивить.
И помните, что знания - сила!
You got a 33.33% from @th3voter thanks to: @filinpaul!
Image Source cloudinary.com
This post has upvoted from @th3voter !For more information, click here!
You can earn daily profit by delegating SP to our bot, 98% of earnings paid out to delegators. To do so, click below:
30SP, 50SP, 100SP, 250SP, 500SP, 1000SP, 5000SP, 10000SP,
Custom Amount
Make sure you have at least 15 SP left on your account.
Great post! You've earned a 11.11% upvote from @dolphinbot

Join the DolphinBot Team for Daily Payouts in Steem! Click here: http://bit.ly/dolphinbot
You got a 11.90% upvote from @ubot courtesy of @filinpaul! Send 0.05 Steem or SBD to @ubot for an upvote with link of post in memo.
Every post gets Resteemed (follow us to get your post more exposure)!
98% of earnings paid daily to delegators! Go to www.ubot.ws for details.
This post has received a 4.03% upvote from @aksdwi thanks to: @filinpaul.
Your Post Has Been Featured on @Resteemable!
Feature any Steemit post using resteemit.com!
How It Works:
1. Take Any Steemit URL
2. Erase
https://3. Type
reGet Featured Instantly & Featured Posts are voted every 2.4hrs
Join the Curation Team Here | Vote Resteemable for Witness
Nice post ! You got 11.36% upvote from @flymehigh. Earn free sbd/steem daily by delegating(renting) your SP. We share high return, click here to delegate your sp to flymehigh if you don't know, how to earn passive income by delegating your SP click here for more info Join our discord You can promote your posts. Thanks.
This post has received a 10.21% UpGoat from @shares. Send at least 0.1 SBD to @shares with a post link in the memo field.
Interested to earn daily? Delegate Steem Power to receive 95% payout rewards. Use this link https://on.king.net/shares to delegate SP to @Shares. Join us at https://steemchat.com/ discord chat.
Support my owner. Please vote @Yehey as Witness - simply click and vote.
This post has received a 10.00% upvote from @msp-bidbot thanks to: @filinpaul. Delegate SP to this public bot and get paid daily: 50SP, 100SP, 250SP, 500SP, 1000SP, 5000SP Don't delegate so much that you have less than 50SP left on your account.
Hey @filinpaul, Congratulations !!! We just upvoted your post with 16.67% power. Keep up the good work. Join our discord channel https://discord.me/SteemBulls