SUCCESS STRATEGIES: Trading Crypto's/Equities with Triangle chart patterns.
Id like to begin, - and continue over the weeks - sharing the strategies that have done me so well, for so long. The patterns I'm about to share with you are timeless. They've been traded for as long as price charts have been around (back in China around the 1920's)
It seems natural for us as human beings to complicate absolutely everything. In some fields its a good thing. inventors making more and more complex machines and technology is the reason we are where we are in our world of tech. With a tool for just about everything. It brings new challenges to be overcome, and so we grow, and our intelligence and problem solving skills grow with it.
However, when it comes to trading this is unnecessary, not to mention deadly to your career as a trader.
I see analysts everywhere attempting to create gigantic, magical, colourful chart patters as if they're trying to duplicate a Monet painting. Trading is as stressful a job as they come, trust me. Why make it harder for yourself by trying to follow, draw and even trade these monstrosities? Your at maximum stress before you even enter a trade let alone trying to manage it when its going against you at that level of stress. Its a recipe for disaster!
Fortunately there is a simpler way, and trust me when I say it will change your trading almost over night if you have some patience and master EVEN ONE of these patterns.
I will note first, while the patterns can be traded on all time frames, the 1hr/4hr and 1D charts are the most successful by a long shot!
The Bull Flag - The Bull Flag is given its name because, well, it looks like a flag. As for the ''Bull'', That's because were looking at it as a bullish (buy) pattern. The first phase the price action will go through will be a rapid steep move up with few to zero retraces. It will most often be a strong move straight up until price comes to a halt, profit taking starts taking place and the price will begin to retrace a small amount and trade sideways. This sideways movement will eventually give a pattern of some kind, and that pattern is more often that not a type of Flag.
In the pictures below you can see the most recent example of a Bull flag pattern in creation before the breakout. We actually traded this one and the buy position was called out yesterday in my blog. Today as you can see in fig.3 the pattern broke and price increased 80% in the following few hours!
Anatomy of a Bull Flag:
- Sharp move up in price. Few-zero retraces showing extreme strength.
- Should happen over the space of hours, and over the longer term, days which can be spotted on a weekly chart. Any less than 3-4 hours of upwards movement could be a pump and dump. This is not a flag you want to be buying as it is being manipulated by people with a large market share and you will likely get dumped on. See https://steemit.com/crypto/@cryptobroye/manipulation-vital-information-on-market-movement-and-how-to-read-their-efforts-for-usdprofit for more info
- Bull flags break at 75-85% of the move from the beginning of the flag to the Apex, which is known as the part at which the lines cross. Using that figure of 75-85% can help you to pin point a perfect entry. SEE FIG.1
- A break before 75% has an 80% chance of being a FALSE BREAK OUT! This could scare you out.
- After 85% the pattern is passed with no break out, it is considered ''BUSTED''. In this scenario the flag becomes un-tradeable and we need to re-analyse the pattern and look for entry. Often after the pattern busts, price will go flat for a mid-long period of time.
- Entry will be anywhere inside this bull pattern once it is established.
- For a more precise entry, you would buy 50% of your full position inside the flag at around the 75% mark
and you would set a buy stop order above the upper side of the bull flag for the second 50% of your positon. - Stop losses would be placed underneath the lower line of the flag.
- For entry and stop loss limits see FIG.5
Triangle rules:
- ANY TRIANGLE THAT IS FORMED IN AN UPTREND HAS A 75% CHANCE OF BEING A SUCCESSFUL CONTINUATION
SIGNAL. THIS IS THE SAME FOR TRIANGLE'S FORMED IN A DOWN-TREND. - ALL TRIANGLES BREAK AT THE SAME 75-85% MARK FROM BEGINNING TO APEX. SEE FIG.1
- TRIANGLES WITH A FLAT TOP/BOTTOM, WILL BREAK THE WAY OF THE FLAT SIDE OF THE TRIANGLE 75% OF THE TIME.
FIG.1
Triangle analysis and the 75% rule:
Where 0% is considered the beginning of the Triangle, and 100% is considered the apex (where the lines marking the triangle's extremities cross) we can use 75-85% as the time in which we would look to buy. You can buy into a bull flag as soon as you feel it is clearly formed, but the safest entry is to have patience and wait for the 75% mark at least! As you can see, this pattern broke at around the 77% mark!
note - If you do not understand, don't hesitate to message me and i will do my best to explain a bit better.
- Green arrow = 0%
- Red arrow = 100%
- Line through the middle, obviously = 50%
Break out in this case happens at around 77%.
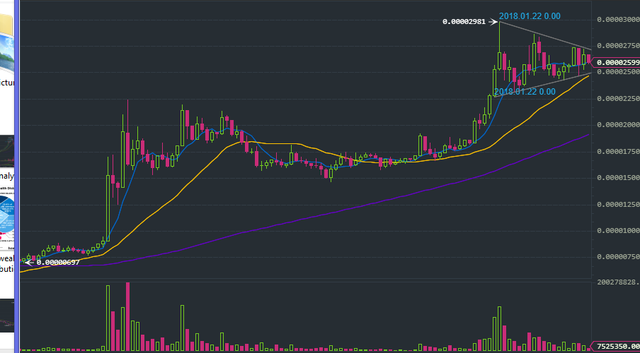
FIG.2
The Bull Flag in the making:
FIG.3
The flag break out at 77%
FIG.4
Here is the same Crypto -but on a 2hr chart rather than a 4hr- showing another Bull flag appearing after the previous break. This could be another entry, however, It would be more advised to use this pattern to manage an already open trade. You can use the under side of the bull flag as your new Stop loss position
FIG.5 Entry and Stop loss levels
- Red up arrow =entry at 75%
- Green down arrow points to a box outside of the flags range, which would be a safe zone for Stop loss.
- Target/Take profit can be left open until signs of a reversal, or can quite successfully be placed at the same amount of price movement as the initial move. You can see on the charts the second push high was as large as the first and that is common. We put a profit target as the same amount of points as the initial move up into the first flag.
As extensive as this guide to trading triangles is, it is a simple strategy once you get your head around the basics and it doesnt ever get any more complex. It is what it is, a humble 3 sided shape that can quite easily be the difference between continuous loss and simple gains.
I hope this post can help you to understand trading triangles and if any one has any questions, Im here to answer them :)
Thanks for reading!
Sam Broye
Hey Sam,
I have recently started following you (and upvoted your post :)). I have been learning some TA since I started in cryptos and have a few questions.
Can you please explain how and where you start drawing your triangle?
Do you try and look out for the initial rise/pump before creating your triangle and then deciding whether it is bull/bearish?
I have some money in this coin originally and when I saw the initial pump, I thought it was a PND group pumping the coin! I traded half of it out and then noticed it went sideways before the second pump - the bull flag. How would you minimise this in the future? Would you wait a few hours after the initial pump?
Thanks!
Hi buddy, of course.
Can you please explain how and where you start drawing your triangle? -
The beginning of the triangle you can draw from the Peak at absolute highs down across the range. Obviously you will notice you can not do this until the triangle is almost full formed, but that's a good thing because it means you wont buy in until you're sure. This is also why i mention if you see a break of a triangle youve already made but it happens too early, you need to take a step back, take a different perspective and RE-ANALYSE the pattern. After a few of these you will soon catch on to the way they should look. They usually take 10-20 bars to form in a strong trend, but can easily consist of 50-100 bars on more sideways trends you will learn to judge them as you go . I can give you the idea and the data but your experience will be the key to mastery of it :)
2.Do you try and look out for the initial rise/pump before creating your triangle and then deciding whether it is bull/bearish?
Check ''Triangle rules'' in the post which states : ANY TRIANGLE THAT IS FORMED IN AN UPTREND HAS A 75% CHANCE OF BEING A SUCCESSFUL CONTINUATION SIGNAL. THIS IS THE SAME FOR TRIANGLE'S FORMED IN A DOWN-TREND. This means if price comes UP to create a triangle, that triangle/flag is a successful continuation sign 75% of the time. Meaning if price is bullish into a pattern, it is a bullish continuation pattern 75% of the time. up move to flag = bull flag =price will break to the upside.
A bearish flag/triangle will show up in a down trend and break to the downside 75% of the time.
3 -
I happen to KNOW that this was a pump. But don't worry it wasn't intended to be a pump and dump. I met the group when i was researching material for the manipulation article i posted a few days ago and after speaking with them they arent all about P&D. They have a group with large buying power and the idea of pumping CND was to kickstart it back to life and that's exactly what they have done :)
Their pump was a pump hold, not a pump dump. This results in MASSIVE outside investment and new money coming in to the stock due to the hype of a big move up and now all of a sudden, thanks to one group of people the coin is flying, which in turn gives the Dev team extra community and investor interest and could bring the entire company back to life :) manipulation isnt always bad when its done with good intentions!
Let me know if i didnt answer everything. I should really do a video there is only so much you can do with words and pictures especially with limited illustration software!
Thanks Sam! Super helpful.
I am a little bit buggered now that I have missed half the gains on my CND. I love their product and what they are trying to do and might have to re-buy into a dip if it comes.
If you have time, are you able to make a post with an example of a Triangle with downtrend and its continuation?
Thanks again :)
Yeh absolutely. I have a LOT of pretty intensive strategy write ups in draft to come in the next few weeks. Ill be sure to add bearish signals in the next post too. I have a pin point volume based reversal strategy coming next. I will try and add bearish example photos to this post tomorrow for you. I guess im being overly enthusiastic about the bull run so i only explained the bull side ;)
I will note, CND as i showed in one of the pics is showing a Bull Flag on the 2 hour chart. Once again if it doesnt surpass 85% and it doesnt false break before 75% it will be a continuation pattern. So if you have CND HOLD for now until we see where this pattern is going. Its not over yet ;)
Awesome!! I will keep an eye out for them and HODL!
Also just read your manipulation post which is really interesting. Great stuff !!
It was a pretty tough one, i knew it was a huge problem but getting the information is NOT easy, people dont talk about it. It was exciting to research to say the least. The most exciting thing about the information, is it puts you in the big guys shoes. Once you know how they play the game you can become part of it. I dont mean start manipulating markets, but rather jump on their moves and dont get caught out in their games. Understanding how they work gives you a massive advantage. I just wish i could get that word to more of the people. I have a lot of info to share and not many people to share it with. Working on it :)
I've just checked. That looks like a continuation. It will be shorter lived than the last triangle but that is just suggesting strength. HOLD mate :)
The apex is coming, if it doesnt break in 3-6 hours it will be busted.
Sweet! I'll watch the 2hr graph and see how it goes :)
BOOM ;) Straight through 3000. Perfectly in time too. was coming up to apex it had to go soon.
nice analysis. check my blog for stock trading stuff!
Thanks buddy, following!
Congratulations @cryptobroye! You have completed some achievement on Steemit and have been rewarded with new badge(s) :
Click on any badge to view your own Board of Honor on SteemitBoard.
For more information about SteemitBoard, click here
If you no longer want to receive notifications, reply to this comment with the word
STOPCongratulations! This post has been upvoted from the communal account, @minnowsupport, by Crypto-moon from the Minnow Support Project. It's a witness project run by aggroed, ausbitbank, teamsteem, theprophet0, someguy123, neoxian, followbtcnews, and netuoso. The goal is to help Steemit grow by supporting Minnows. Please find us at the Peace, Abundance, and Liberty Network (PALnet) Discord Channel. It's a completely public and open space to all members of the Steemit community who voluntarily choose to be there.
If you would like to delegate to the Minnow Support Project you can do so by clicking on the following links: 50SP, 100SP, 250SP, 500SP, 1000SP, 5000SP.
Be sure to leave at least 50SP undelegated on your account.
Wow! I'm pretty new to crypto, and this helped me out a lot. I never quite figured out what the bull flag is. hahaha. followed.
thanks buddy :) plenty more to come!
Speaking my language! Yes, bull flags and triangle patterns have been quite reliable in crypto.
Heck, if ascending and descending channels have made for great day and swing trades.
Glad to see more chartists coming on steemit. Welcome to the club :-)