Technical Analysis on Ethereum: IS ETHEREUM NEARING BOTTOM?
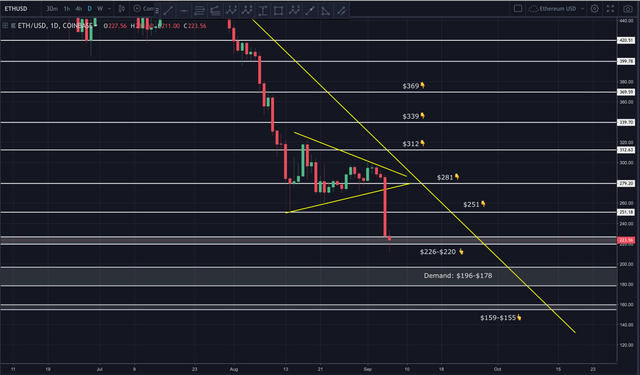
Ethereum broke down to new lows for 2018. It’s currently finding support between $226-220. This bearish momentum may not be over, but it does appear to be approaching bottom. There’s a strong demand zone between $196-$178. This seems like a logical entry point.
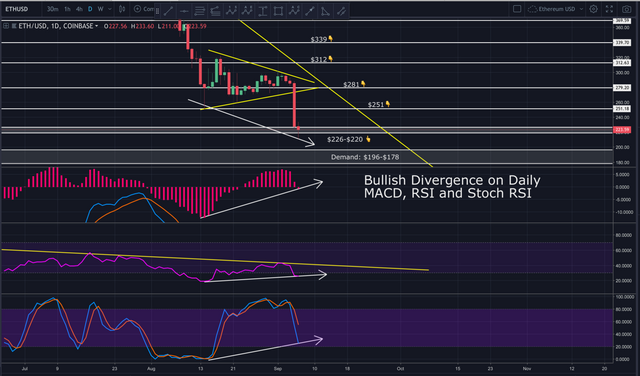
The daily MACD, RSI and Stoch RSI are all showing bullish divergence.
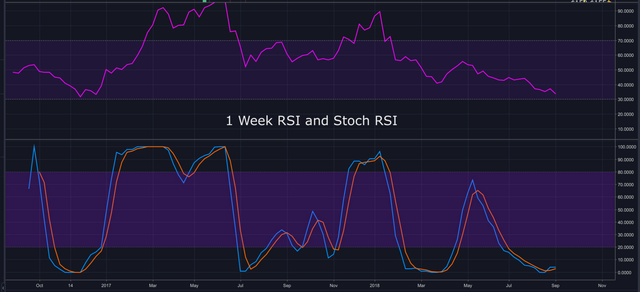
The 1 week RSI is nearing it’s all time low. The 1 week Stoch RSI has been oversold for nearly 2 months.
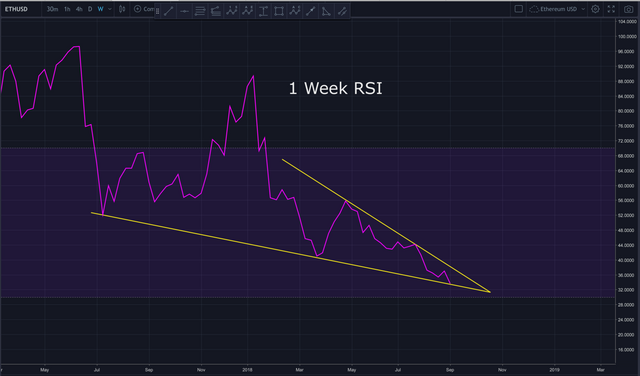
Zooming in on the 1 week RSI, we can see a bullish looking falling wedge. If the RSI breaks above this wedge, it could indicate a shift in momentum towards the bulls.
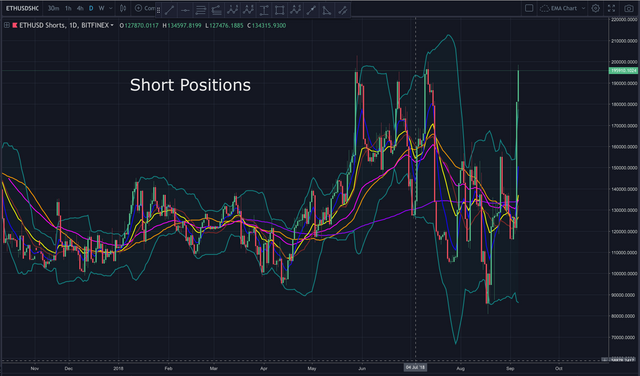
Shorts are stacked to near all time highs. This is a real sign the bottom is near.
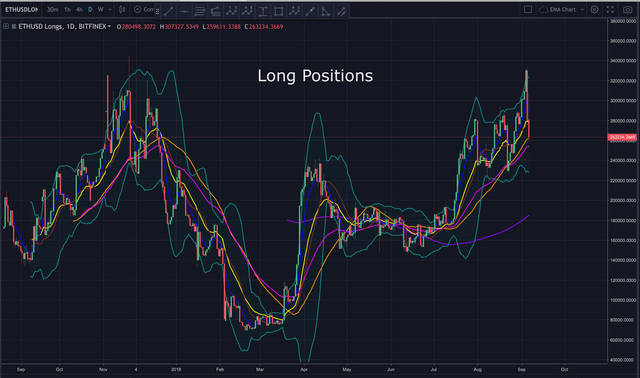
Long positions remain fairly high as well, but have fallen off over the last couple days. If this trend continues, and shorts continue to stack, I think we could see price bottom out and reverse course in the next week or two.
In today’s video analysis, I discuss my Elliot wave count, where my buy orders are stacked, price movement over the next week and MUCH more information not found above. I hope you find it helpful.
Video Analysis:
If you’re viewing this on a site other than Steemit, and you don’t see the above video, navigate to Steemit or TIMM (https://mentormarket.io/profile/@workin2005?aff_id=Workin2005) in order to watch.
BIAS:
Short Term: Slightly Bearish
Longterm: Bullish
I hope this has been helpful. I’d be happy to answer any questions in the comment section below. Until next time, wishing you safe and profitable trading!
Workin
If you found this post informative, please:
Open an Account on Binance here:
https://www.binance.com/?ref=16878853
Support the Crypto Ecosystem with Brave Browser:
https://brave.com/wor485
Twitter handle is @Workin2005 and Facebook is https://www.facebook.com/Workin2005
Published on:

by Workin2005



"Zooming in on the 1 week RSI, we can see a bullish looking falling wedge. If the RSI breaks above this wedge, it could indicate a shift in momentum towards the bulls."
I think you mean bearish where you said bullish?
I am always long-term bull on crypto!
No, I meant bullish. A falling wedge is a bullish pattern. Doesn't mean it has to break bull, but probability favors a break up, not down.
I'm generally longterm bull on crypto as well...but not on all coins. I believe we'll see a lot of failures in the next year, but also a lot of success.
Ah, my mistake. I figured reversal so bear to bull. I don't know much about trading as you can probably tell! :D
No problem. Thanks for stopping by.
thats why i sold my ethereum just one week ago i had doubt about price!
Good call!
yea... :-)
Thanks for this -- and other -- video analyses, @workin2005!
My pleasure @bananamemos
Just wanted to say that I've been following your posts for a while now. Took a while to complete my sign up but finally got account confirmation today. Always find your posts informative and well balanced. And yes, please do carry on with the videos :-)
Thanks for the kind words @cedricthebull. Welcome to Steemit!
I was thinking of buying ETH at $150 but may have to re-think if bitcoin is gonna continue tanking this year. what im wondering is when Eth does find its bottom how will it respond. will it be like 2017 June-Nov and start another large equilibrium pattern thats sorta slow and drawn out or will it start really outperforming bitcoin and make fast moves back up. I guess it depends on where they are in the scalability area, im thinking the former.
Agreed...I think once Bitcoin starts it's bull run, it'll initially out pace ETH.
I never thought I would see these levels again! It may make sense to buy some soon for the long term as I can’t fathom a blockchain driven world without some sort of Ethereum Network.
I'd wait and stack buys between $195-$179. That seems like a solid demand zone and a very logical bottom. Just remember to keep your stop tight. If Bitcoin breaks down below $5,800, ETH will be eyeing the low $100's.
I think it could be a little bit lower however. Too early to buy.
Posted using Partiko Android
Agreed...which is why I suggested waiting until it hit the $195-$179 demand zone.
Nice job @workin2005, quality post as always. A lil' nitpick though, I am not sure I agree with you when you say there's strong demand between $196-$178, unless there's something I've missed.
Based on volume profile, most of the auction is taking place around $290 - $330 and this latest dump seems to have been caused by some large sell-off from an ICO/large holder, possibly to wreck long traders as you suggested.
That being said, I wouldn't be surprised to see the market auction its way back up to that zone... unless Bitcoin decides to cr#p all over the market again.
Cheers!
Hey my friend. Thanks for the kind words. No doubt the most action is around the $300 range. Remember, volume profile only shows where the most buying and selling takes place. It doesn't show supply/demand zones...only likely areas of support/resistance. The areas you're referring to is the closest SUPPLY zone where there are likely many sell orders waiting. This is why it'll most likely act as resistance.
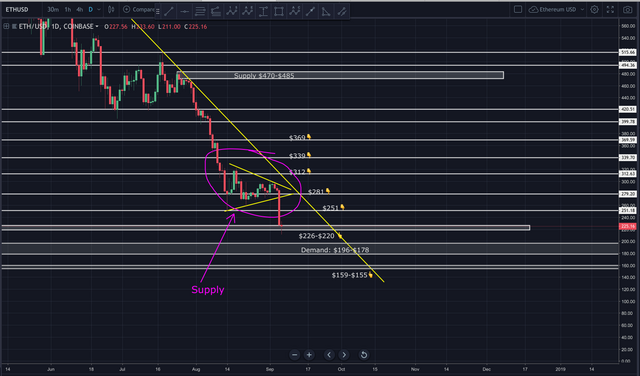
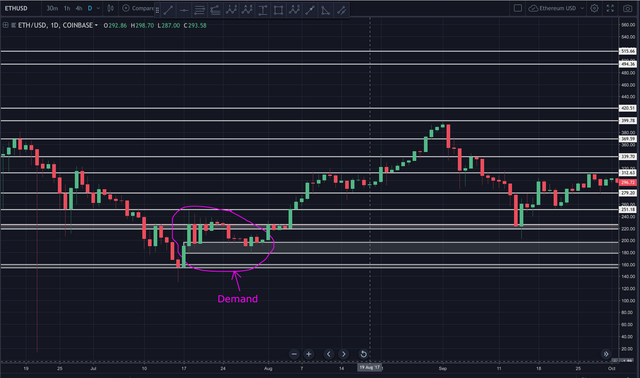
The demand zone I'm referring to is between $196-$179. It's the closest DEMAND zone where there are likely many buy orders. This is why I expect it to act as the next support if/when price breaks below currently support.
Hope that makes sense. Let me know if you need more clarification.
I agree...when etherum bounces, it's likely to return to the $290-$300 range. The question is, where will it bounce? As I said, if current support breaks, I think a likely area is somewhere between $196 and $179. That said, I'd suggest keeping a TIGHT stop if you take that trade. If bitcoin breaks down, we could see ETH in the low $100's very quickly.
Excellent response, nothing to add to that.
Man, if ETH were to dump to $100 I'd buy myself 32 ETH in a heartbeat so I can stake once Sharding rolls out.
Absolutely.