RE: Technical Analysis on Ethereum: IS ETHEREUM NEARING BOTTOM?
Hey my friend. Thanks for the kind words. No doubt the most action is around the $300 range. Remember, volume profile only shows where the most buying and selling takes place. It doesn't show supply/demand zones...only likely areas of support/resistance. The areas you're referring to is the closest SUPPLY zone where there are likely many sell orders waiting. This is why it'll most likely act as resistance.
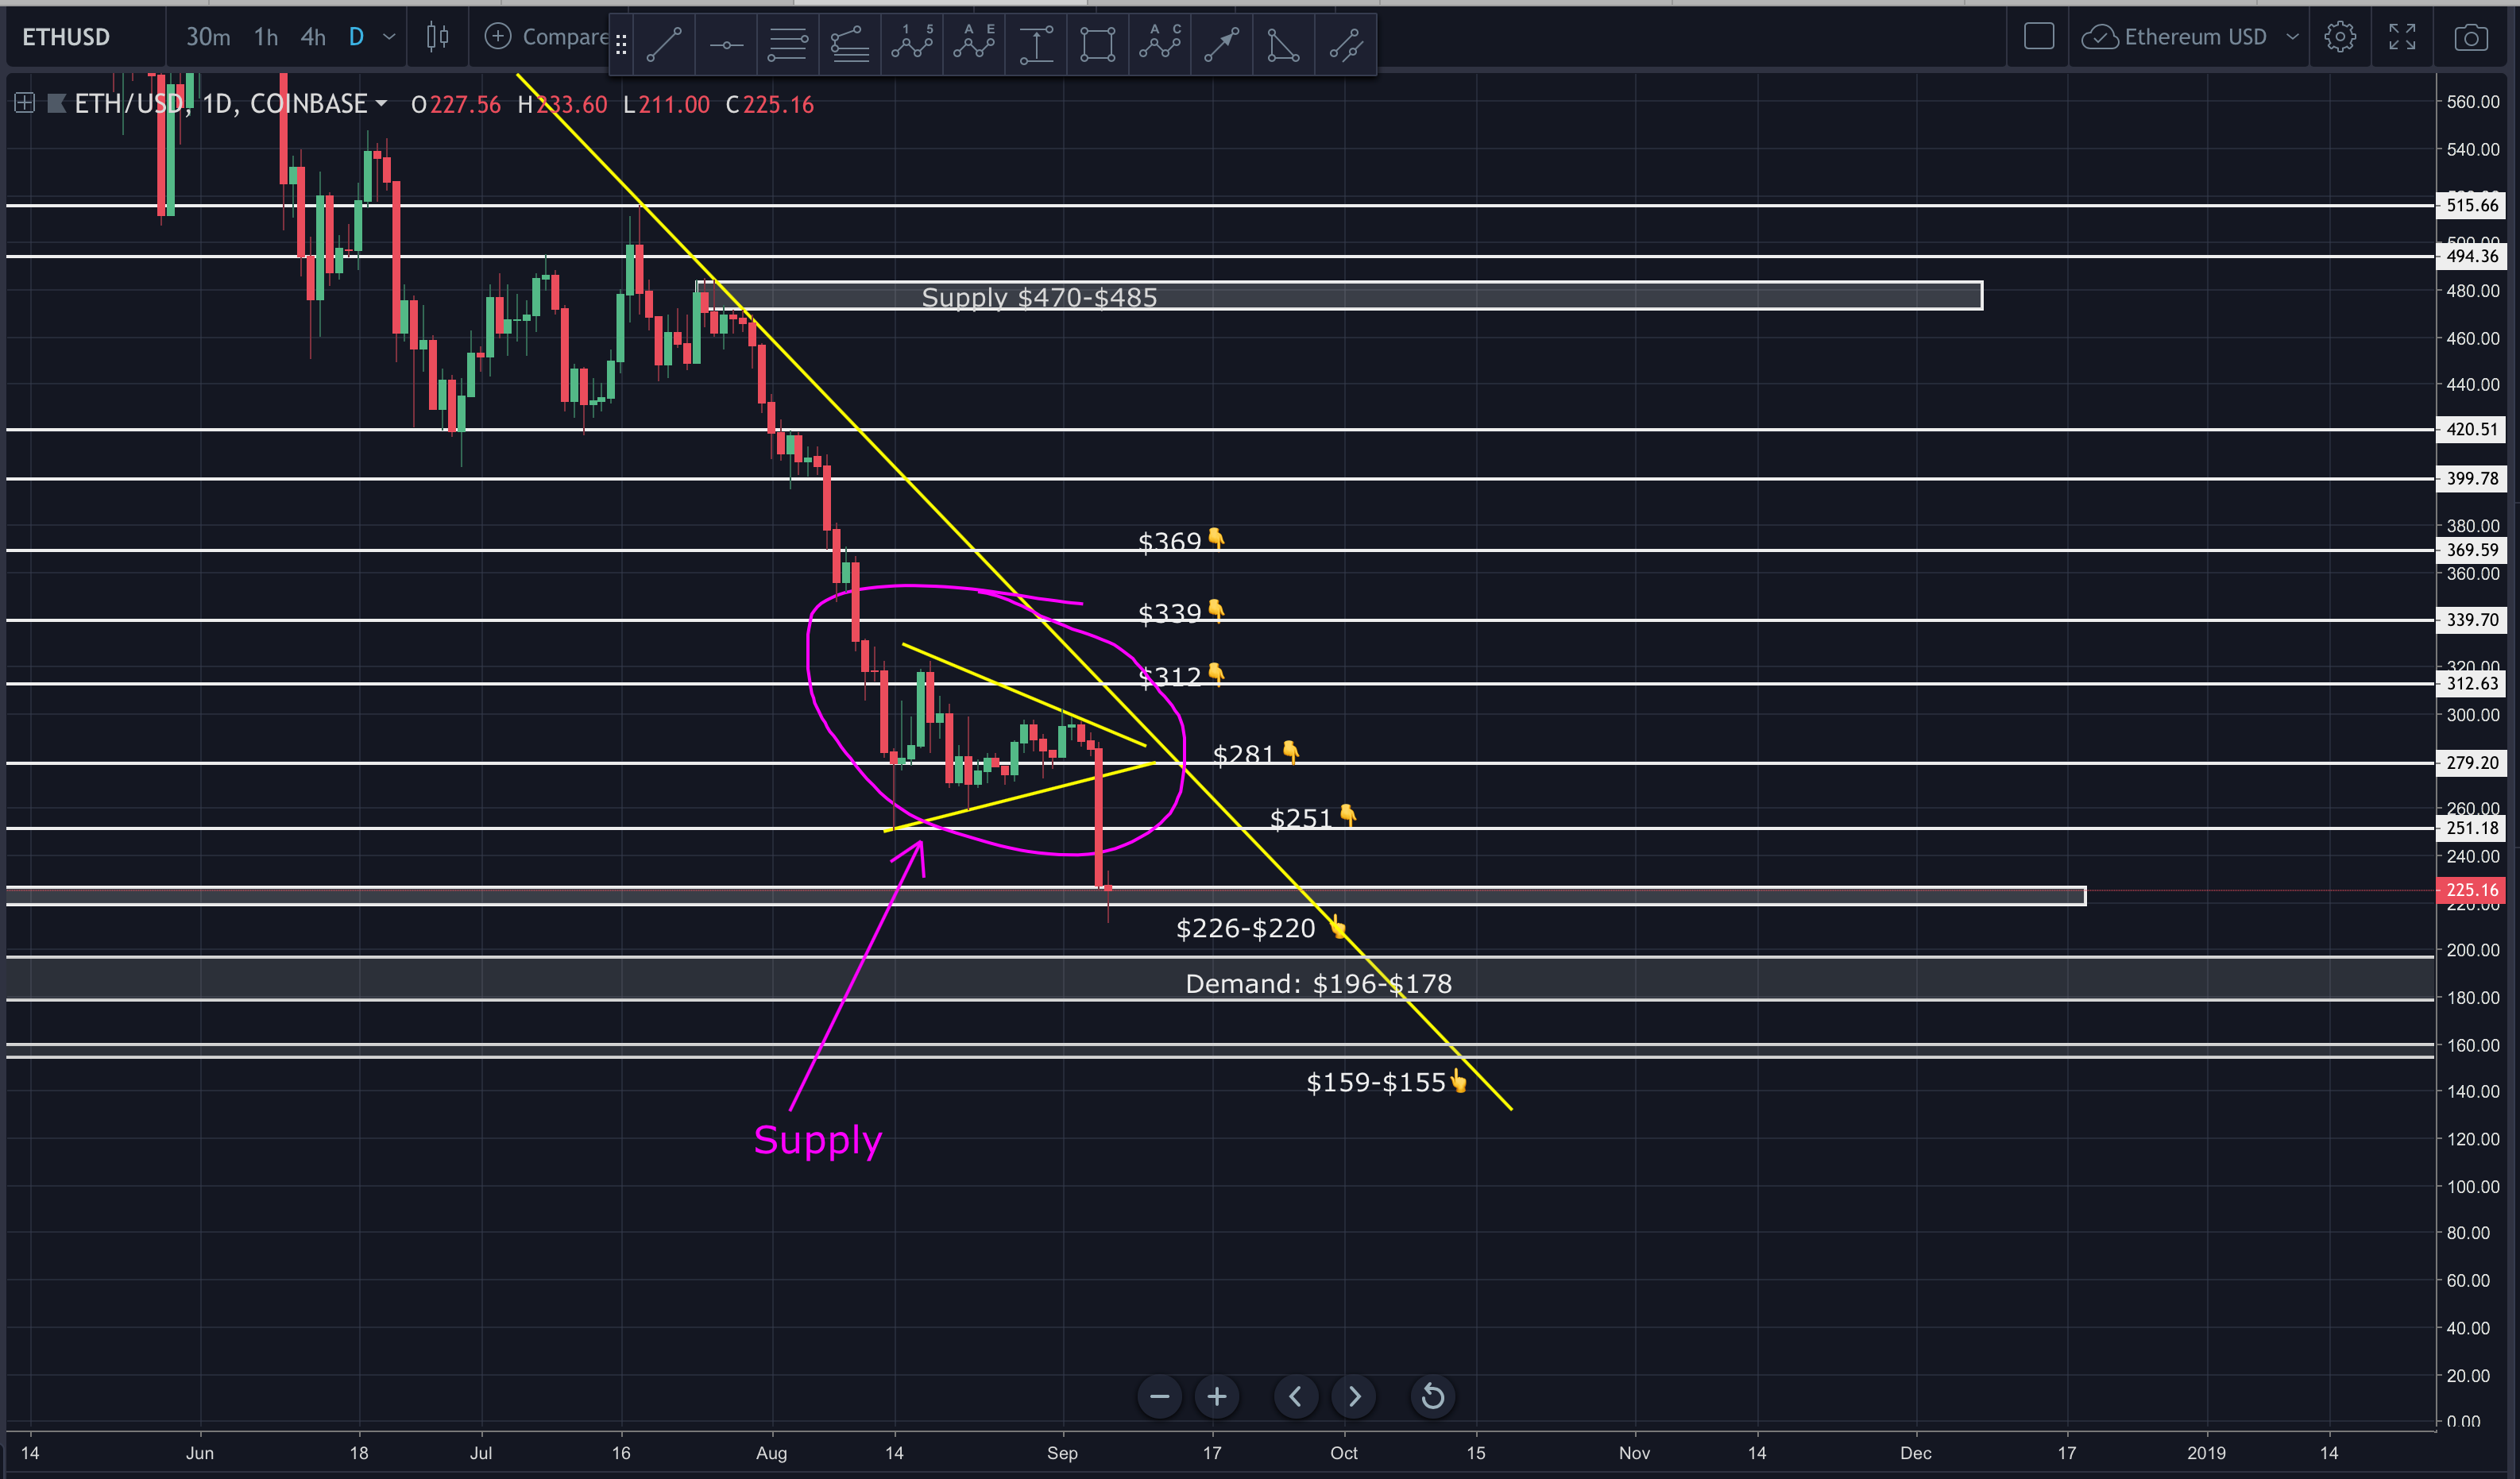
The demand zone I'm referring to is between $196-$179. It's the closest DEMAND zone where there are likely many buy orders. This is why I expect it to act as the next support if/when price breaks below currently support.

Hope that makes sense. Let me know if you need more clarification.
I agree...when etherum bounces, it's likely to return to the $290-$300 range. The question is, where will it bounce? As I said, if current support breaks, I think a likely area is somewhere between $196 and $179. That said, I'd suggest keeping a TIGHT stop if you take that trade. If bitcoin breaks down, we could see ETH in the low $100's very quickly.
Excellent response, nothing to add to that.
Man, if ETH were to dump to $100 I'd buy myself 32 ETH in a heartbeat so I can stake once Sharding rolls out.
Absolutely.