RE: Trend Analysis: Altcoins Suffers As BITCOIN Goes up. Top 82 Altcoins down to NEGATIVE Trend, What's Going on?
There is a reason while they are called trading PAIRS: Imagine 2 elevators going up, one is moving at 6 times the speed of the other while they are both ascending. If you stand inside the fastest elevator(lets call it elevator BTC) looking down to the other one, from your perspective it seems the other elevator is going down(let´s call it elevator ALTCOIN). It is only when the elevator BTC has slowed down or stopped altogether, that you can begin to calculate how many floors elevator ALTCOIN actually went up. So, it IS true people are un-diversifying their investments for the fork(I am doing it too), but to that, add the "elevator perception effect"(can a professional trader/economist tell me how is this effect called? Since then I shall call it "ELEVATOR ACTION", like the dearest console game of my childhood :P). You can cancel that mirage of perception matematically by ADDING the percentage of bitcoin price raice since the last FIB retracement. It is even easier to calculate it if you do it day by day, or week by week. For example(and this is a REAL example) BTC has gone up about 11,01% since the last FIB retracement ended on 2017-10-05(YYYY-MM-DD). So to cancel out the mirage, ADD that percentage of any altcoin and you will see the REAL rise/fall of the given altcoin.
Note: This is ONLY for the ALTCOINS that are traded AGAINST BTC pairs and have NO USDT counterparts.
Man you are good. But you are wasting your talent on those Youtube videos out there. They are supported by nothing.
They talk a good talk, that's their skill to sell their videos. Most people will have vested interest. Don;t get swayed by listening to them for hours and hours. When the big people trade they don't look for fabonacci and Eliot wave and blah blah. Those all are BULL shit . Absolutely supported by nothing.
That's ridiculours to say, that since a particular has seen five waves no it will have to retract.
Can you predict what I am going to write next? No.
It's exactly the same. We use data analysis to see how the market behaved not for 'how the market will behave'.
The rule is simple. Pick a potential coin, spot the bottom and invest and sell when it peaks. DON't bother yourself with all those rubbish details.
I see that you are too much involved.
Actually no, I don´t pay attention to people who are just "selling their videos". I do a systemic analysis, and my background is in computer science. Now I see that you´ve dismissed all information without separating the good stuff from the garbage in those videos(hey, there is even some useful stuff that come from the worst people). I come from the mindset that even a computer virus can teach you useful code if you know how to look at it. Financially, its starting to pay out since the methods of trading that I use work out most of the time.
You have potential but you have too much emotion bro. The market is not a living person, it´s not an oppponent you can game, it doesn´t care if you win or lose, how much you win or how much you "bet". I feel like teaching you some stuff(if you let me). I won´t charge you anything, since I´m not selling anything, but when you see that the methods work, be sure to like my posts. You scratch my back, I´ll scratch yours.
Systemically, you can understand all trades as a series of ARGUMENTS. How? Well, they are like "discussions" on what the price of a given coin should be. As in steemit, in trading there are minnows, dolphins and whales too, and whales can crash a market just by moving their tails(or placing a very big sell order). They trade using patters 90% of the time(because most professional traders actually use a "rulebook", so if you learn their patterns you can predict what the whales are gonna do 90% of the time. I´m sure that as a poker player you can appreciate the value of that. What I´ve done personally is to learn most of that stuff and SIMPLIFY it so I don´t get caught in overcomplicating things. I´m a swing trader, meaning I mainly use price action to trade and only 3 indicators.
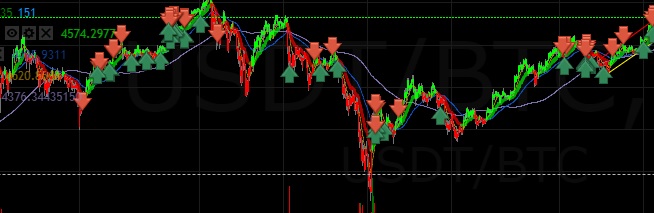
This is part of my trading screen. As you can see by the arrows(the red arrows are sells, and the green arrows are buys), In that timeframe I´ve won on every single trade. That´s not luck, it´s science! Are you not convinced yet? The analisys is actually easier than you think. Every price goes through channels, for example that channel is the BTC in the last 5 days. Can you see the channel clearly? The bottom is that ascending straight yellow line and the top is the ascending red line. ANY good trader can detect a channel, and that gives you about 60% to 70% chance of trading sucessfully on a bullish market(a market that is on the rise). That channel is not provided by the trading software, it was drawn by me, and what it means is that usually the price rebounds both of the top and on the bottom(unless specific conditions are met). Why not just buy and hold? Because every coin will have pullbacks on its way to the top, and if you know where they will be, you can also make money on a descending market. The investor point of view(that would be you right now) is "let´s just buy this coin low and hold it while it rises to top". That works, but it takes months or years to make a profit that way. It´s good, but you can do better. Now here I´m telling that you can predict many many things in the market(dare I say most), so a trader´s point of view is "let´s ride the ups and the downs and make money using the market volatility. Why? Well, because it makes 10 times as much money, of course! But to get from "investor" to "swing trader" takes a lot of time and effort(been trading and learning for about 6 months now). I´m no "black belt" by any means, and I´m aiming at getting at "pro trader" level myself, but I can teach you one thing or two about it.
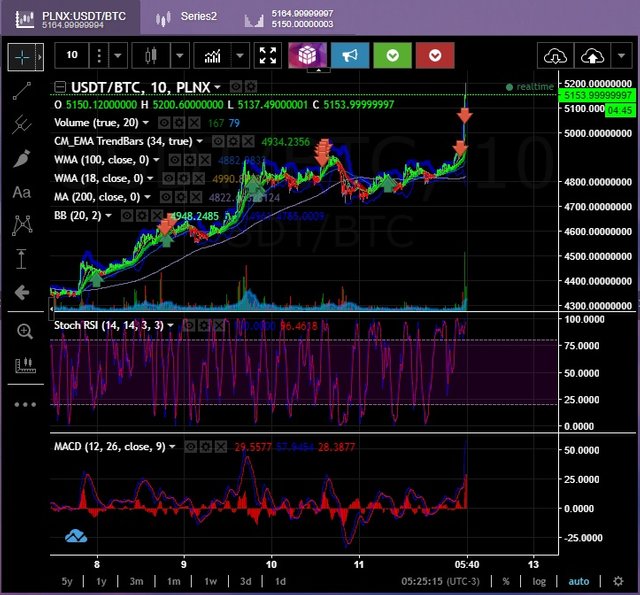
It looks complicated but it´s actually very simple.(or rather, I´m gonna simplify it, by a lot). From bottom to top, the bottom red and blue lines are the MACD. What is it? The MACD detects what you could call "inertia" of the coin. Say for example that a car is travelling at 50 km/h and then it slows down. The speed factor it´s a thing you can measure, analyze. And this does just that. It not only tells you when a coin is moving up, but also HOW FAST is moving, when is decelerating and when it will stop on the next hour timeframe. (I´m actually using metaphors for explaining this since they are easier to understand, I had to learn from this: http://www.investopedia.com/terms/m/macd.asp Will you look at that? When i first read that, it was like ancient egyptian to me. Now I can proudly say that I understand every word and concept there)
The next indicator, in the center of the screen, the blue and red lines with very narrow turns, is the Stoch RSI. That tells you WHEN the price is about to turn in the super short term(5 minutes).
On the top of the screen there is the price chart, and the channels are drawn by uniting all the lowest points(supports) of the prices by a line, and then unite all the highest points(resistances) by another line. Now you got 2 lines that tell you that, when on a bull market(rising market) or a bear market(declining market) the price action is going to rebound on those walls most of the time. The most unpredictable kind of market is the horizontal market, which is the nemesis of every trader.
That is a horizontal market(technically its a bearish one followed by a lateral movement), as you can see, I continued to make money most of the time during the past month even through bitcoins uncertainty, while most amateur traders just panicked and sold and the true believers held their coins. The only thing I regret is not getting on time to that big dip to 3200usd since I was actually away on a business trip and I don´t trust my analisys enough to leave many automatic trades(yet) over the course of days.
Anyway I´m getting off track. What I´m aiming to show you is that this is not poker, since your opponent is not emotional and you can predict what the market will do(at least in the broad strokes) most of the time. Yep, you´re playing a rigged game in a table where every one knows how to count cards. Wanna learn to count them? ;)
Btw, as proof of forecast, I´m gonna tell you that BTC is goin down to at least 4300 over the next 2 days, even though its at 4600 and on the rise as we speak. However if you look at things mid term, it will probably go up, testing resistances and trying to get to 5000 just before the october 25th fork. Let it be recorded :P
Anway, there are plenty of professional analysts out there who can give you a way more detailed analisys.
Also, It seems that I´m missing my own point. The bigger point here is that a good trader predicts, but an excellent trader always has a plan B in case he´s wrong about his own predictions. Your goal is to always have a plan in which you win in the mid term, no matter what the market does.
wow.. look at this man. Told you are too much involved. cya after two days.
Well, looks like I was right and wrong at the same time. The market did go down from 4900, but never reached the 4300 I predicted. The correction reached its lowest price at 4716 and it recovered went up way sooner than expecte, now crossing the 5100 threshold. But as I told ya, I still made money. That is the thing: make a setup and plan your trades so you win money no matter what happens, even if you´re wrong or you over or underestimate when predicting. Cya :D
haha. You made money because the market is always goes up and down. Tell me any price and I would place a trade on that price and I would still make money.
The only difference is timing. When you tie your prediction to time. You would always be wrong. The point is not making money. The point is prediction. Thank you btw.