RE: A Look at the Charts - ETH, BTC and EOS - Oh My!
Nice video. Technicians often disagree as technical analysis is not 100% correct.
I'm going to offer a different alternative.
You point out correctly that BTC would have a long way to fall to get to it's 200 day ma.
However fundamentally we disagree, as you mention 10k btc would be a buying opportunity at those levels.
I would argue that assets/ stock indices/ commodities that fall after such a rise are better buys, but are ultimately underpinned by real value and business', I think BTC will be replaced by a better option. Whereas copper or the S&P500 are not going to be replaced.
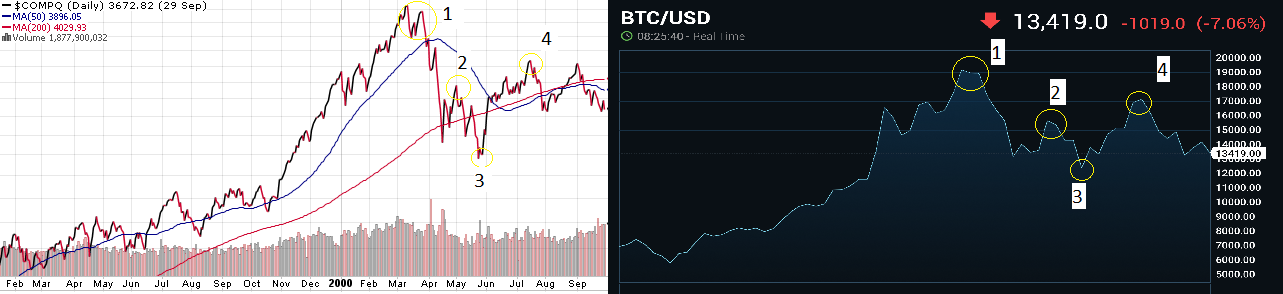
I think BTC's chart looks like the DOTCOM bubble. I point out the similarities in the chart above. However unlike the Nasdaq, if BTC falls that far..
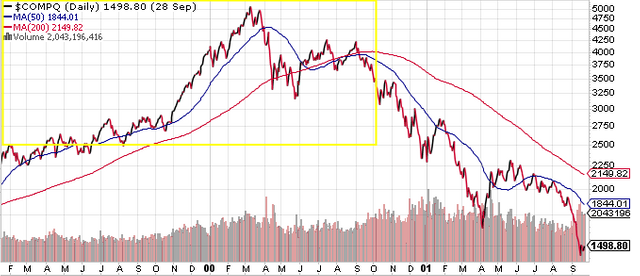
It's not coming back.
Still true