Support and resistance technical analysis
For part two in my series of improving your technical analysis, I'm going to talk about support and resistance lines.
This will help in determining significance of flags, as mentioned in my previous post here - https://steemit.com/cryptocurrency/@technicalanal/improve-your-technical-analysis-flags-part-one
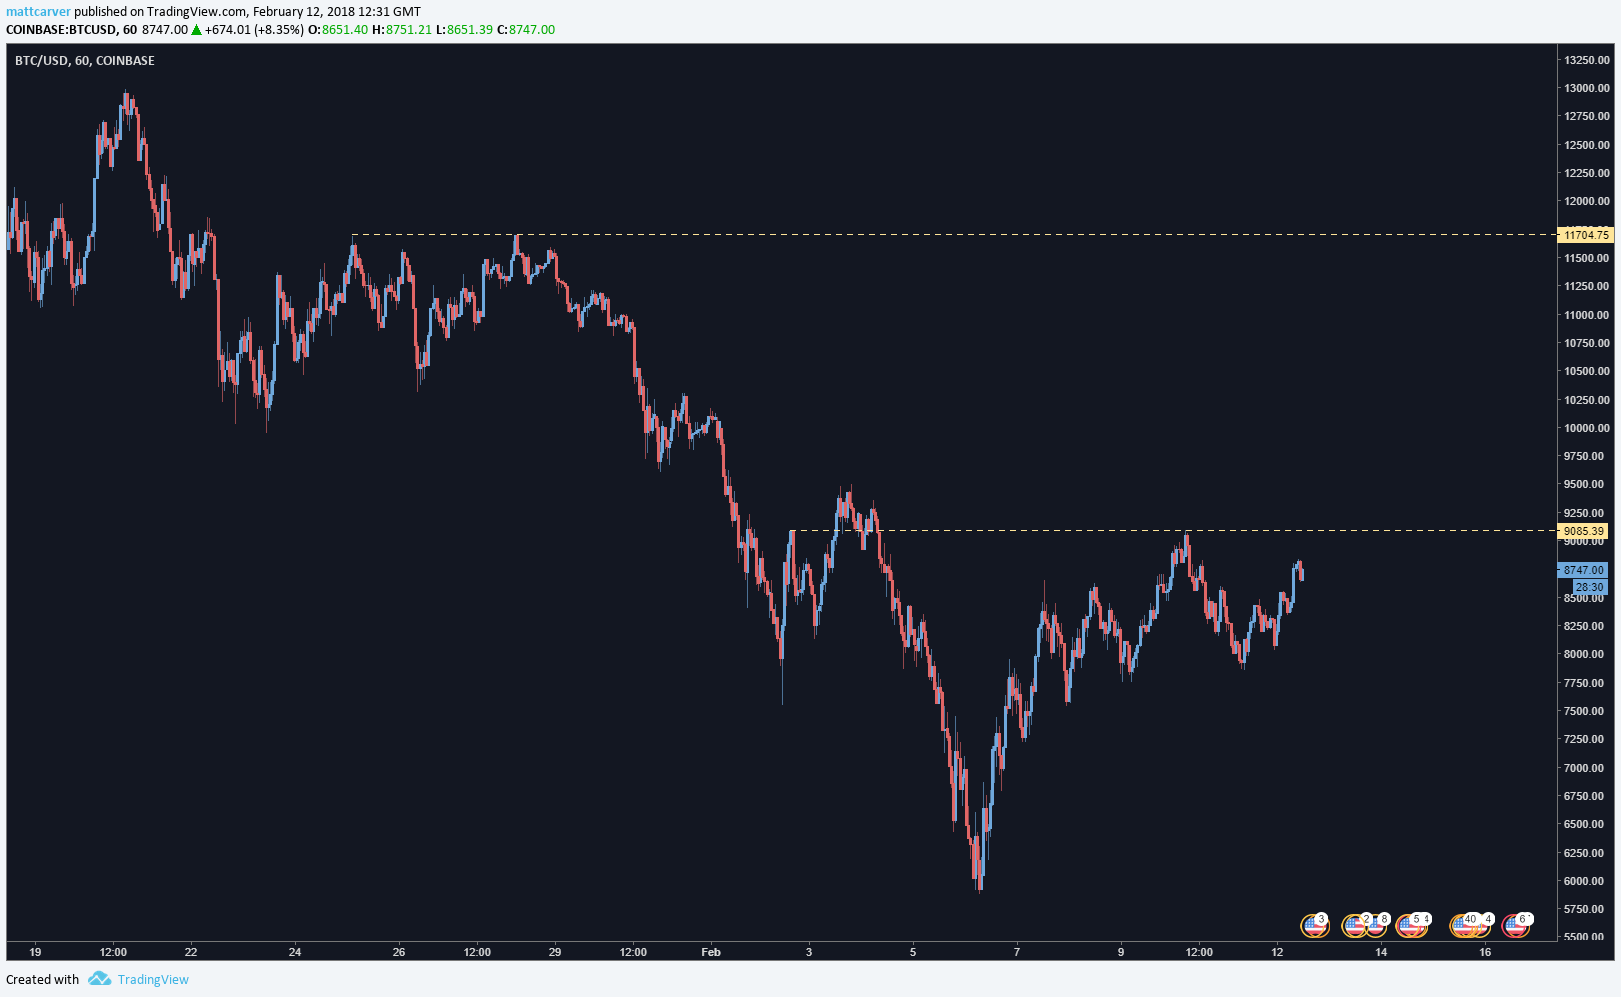
Support and Resistance simply refers to any line you can draw across the chart that appears to have been holding price up, or keeping it down for a while. The more touches to the line you can see, the more “important” a line of SR it is, and you can often find them at the limits of a flag.
Here's a quick example of resistance:
And support:
You can find many examples of support and resistance across different timeframes.
One of the main misconceptions about support and resistance is that the more times the line is tested, the "stronger" it is, when this really is the complete opposite to the truth.
If you look at any line that has been tested several times, you will see that each bounce is usually weaker and weaker every time it's hit. The reasoning has to do with supply and demand, which I'll cover in another article, but essentially, there are less orders each and every time price revisits a line to provide the strength needed for a reversal.
It's completely possible to use support or resistance as a method of trading on its own, because when used effectively, they can provide very nice trades and great returns.
My main use for them is to identify good entries, but mainly, to use resistance to see how high price can go before being potentially bounced. This is where I'll look for an exit.
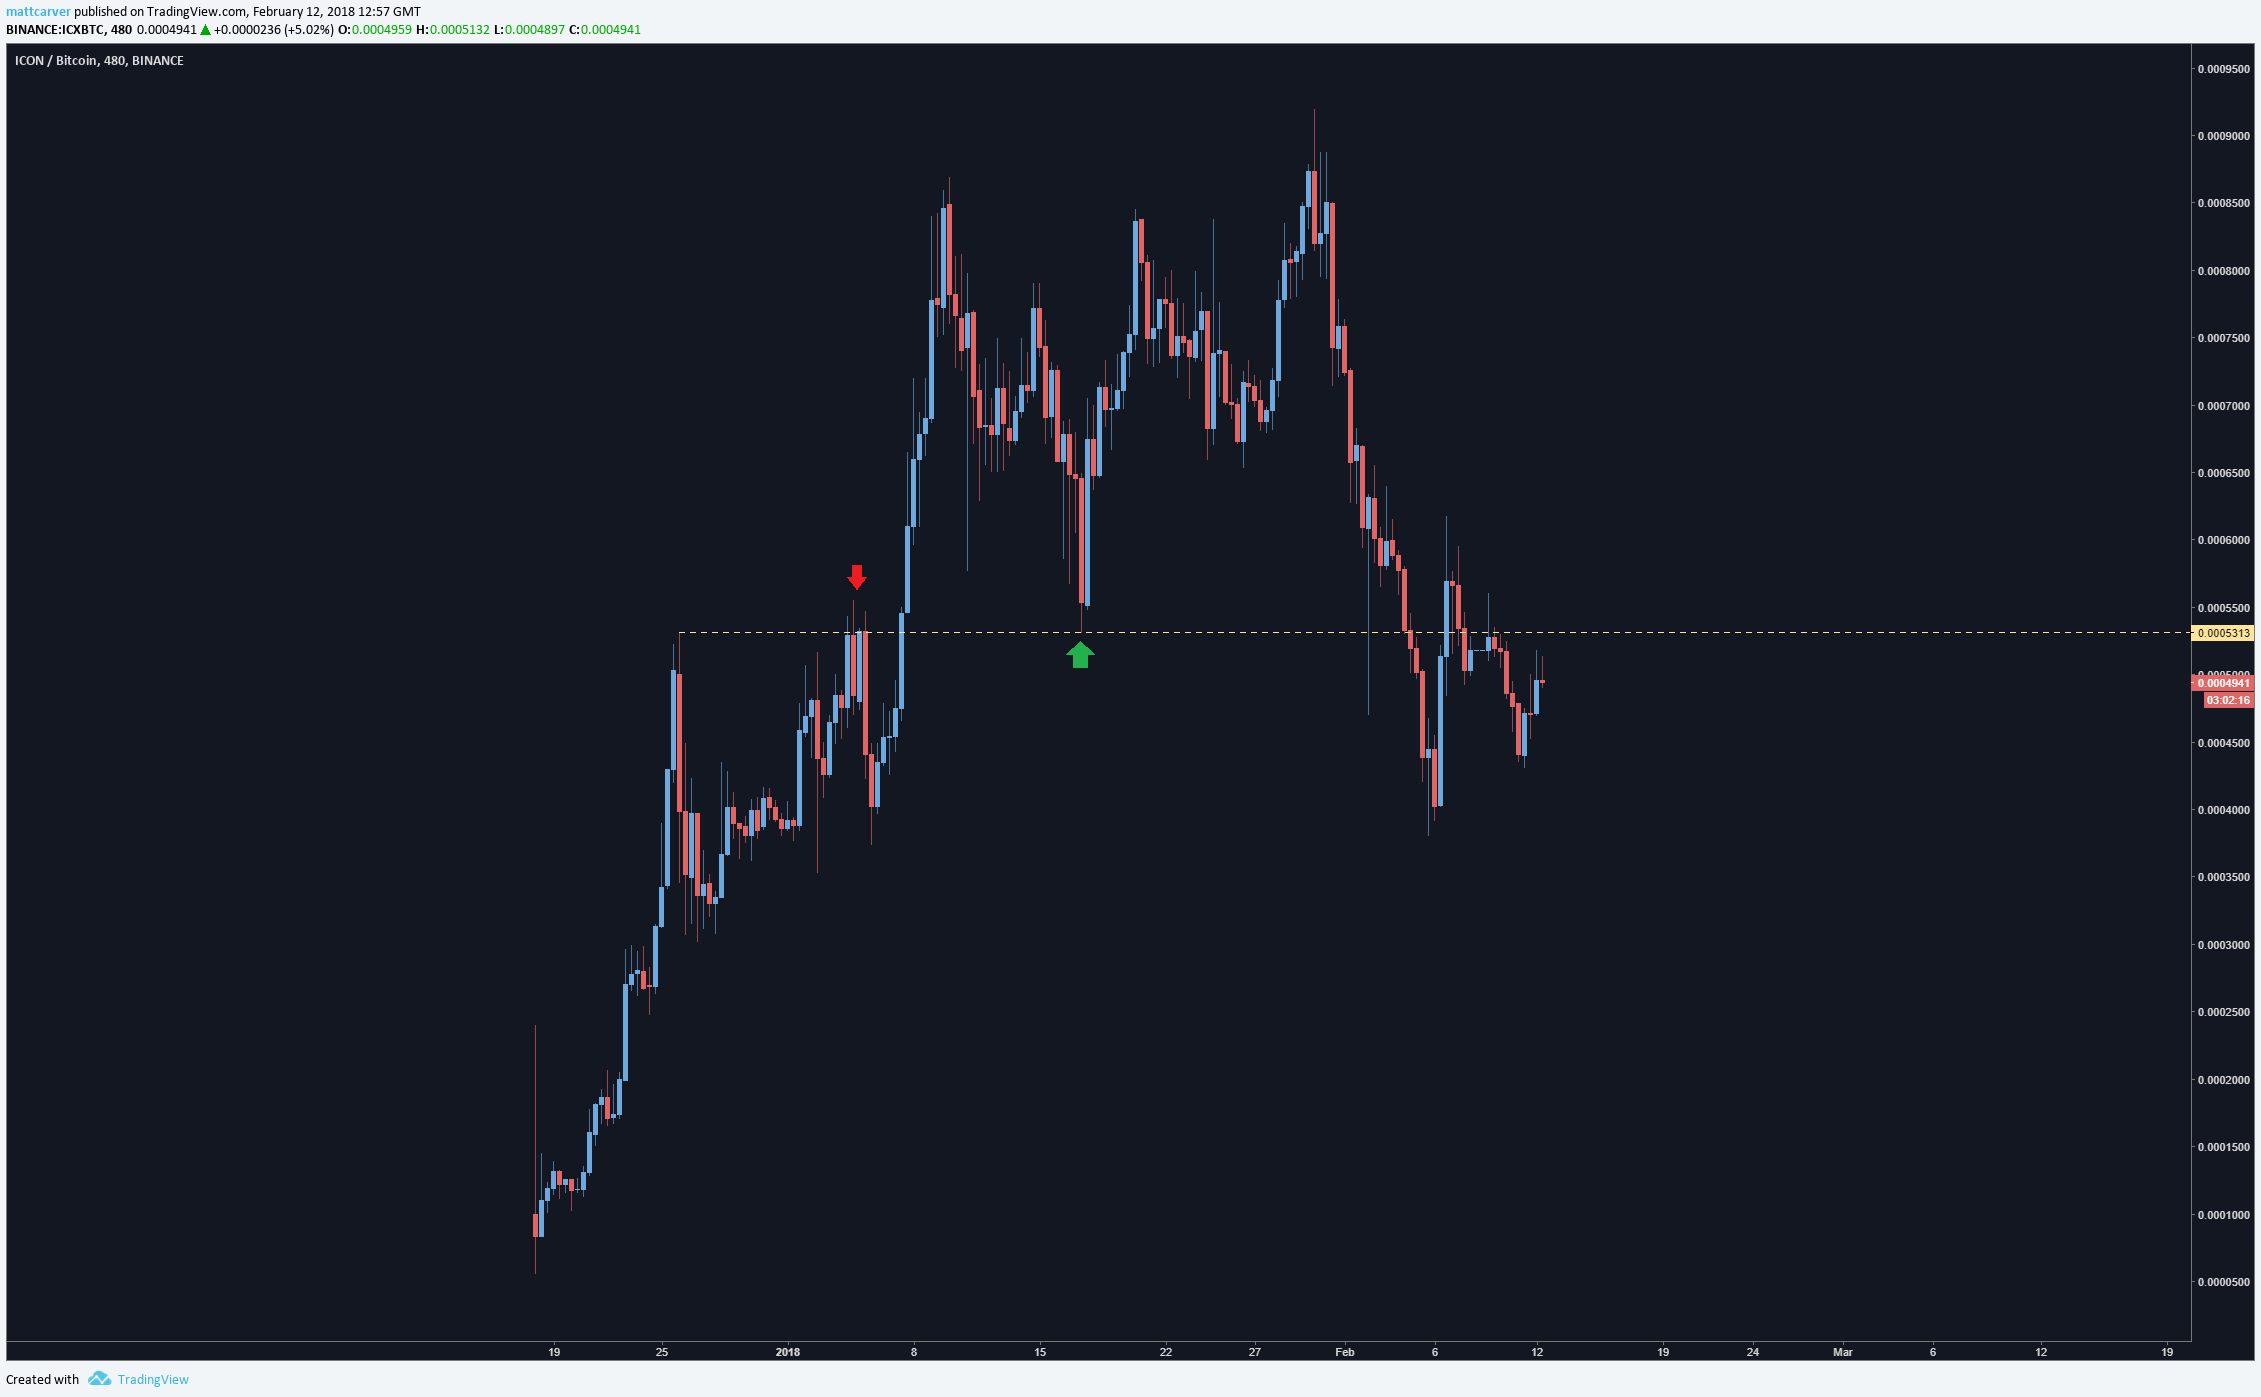
In reality though, the best trades are from when a SR line that has been holding price within a range for some time is "broken". That's to say, price has pushed through a resistance line, and then dropped back down to touch it, before bouncing off and continuing upwards. Resistance has become support, or vice versa.
Here's an example:
This would have been a great trade to take when price was approaching the resistance turned support line, or otherwise known as SR flip. It went on to make an over 50% gain.
Sometimes you'll notice with support and resistance lines that price will push just above or below the line you've drawn and this is called a "breakout". Many SR traders will wait for price to break through, and then set an automated order to sell the second price breaks back below support.
This is probably one of the most common errors in SR trading, as price will almost always revisit a broken SR line.
Interestingly enough, these sell orders on a support line fuel the market to bounce price on the broken SR line. If a resistance line is broken, and somebody uses the line as their stop loss, they are placing a sell order onto it. Once price revisits that level, there is liquidity there for someone to buy up their order and provide enough to push price back up.
Remember my post about sell walls and buy walls? That is an example of it in its purest form. https://steemit.com/cryptocurrency/@technicalanal/buy-walls-and-sell-walls-you-re-doing-it-wrong
There is a lot of psychology in trading, and these lines provide a lot of information. They also can help you define zones and add a bit of sense to a chart, even with just a single line that can help you see some perspective on where we're going to or coming from.


