Improve your technical analysis - FLAGS (PART ONE)
Right, this is the first part of a series I'd like to start where I can help you improve your technical analysis on crypto charts (or forex and stocks, for that matter).
When thinking about the first beneficial thing to teach, flags immediately came to mind.
We use flags to help us shape the picture of a chart - where are we coming from and where are we going to? It's with this technical analysis that we can determine good entry and exit points for our trades, instead of looking at taking something in midair.
Flags form when price breaks a previous important area, and then continues in the direction it was going. In other words, a flag at the end of a pole!
In order to determine if a particular section of price has broken something important, you must always be looking further to the left. More on the importance of an area in my next article. For now, we'll just look to identify flags on a chart.
Let's start with an empty chart.
Where I've bashed traditional indicators in my previous article for not allowing you to understand a chart, here, we can begin our journey of being able to read price action and putting the pieces of a puzzle together.
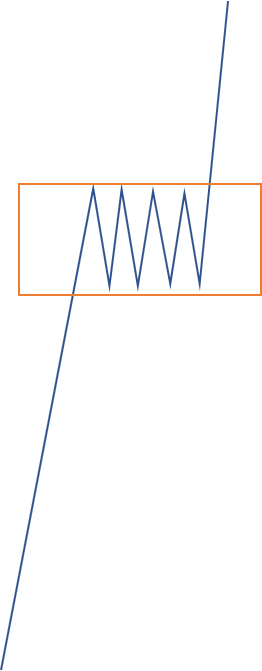
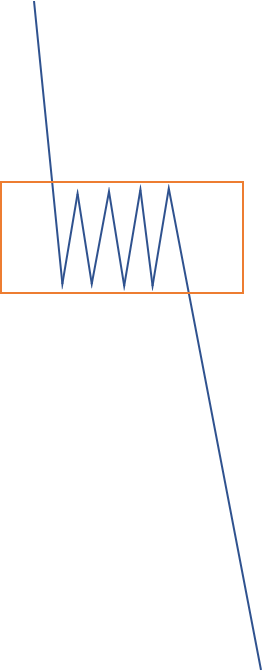
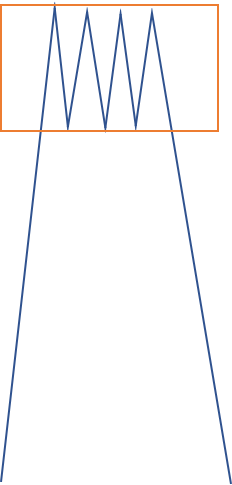
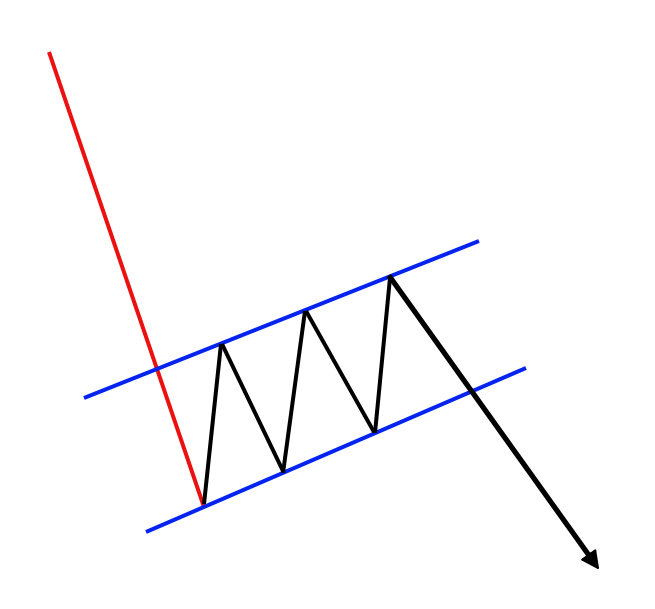
Here are some ultra professional pictures I've drawn which show a flag in its most basic form.
This is a RBR - rally, base, rally. The flag is in the consolidated area in the middle which helps us piece together what is happening, and where to look back on in future.
Similarly, we have a DBD - drop, base, drop.
And finally, a RBD - rally, base, drop. We can have the opposite here also - just imagine the picture flipped vertically!
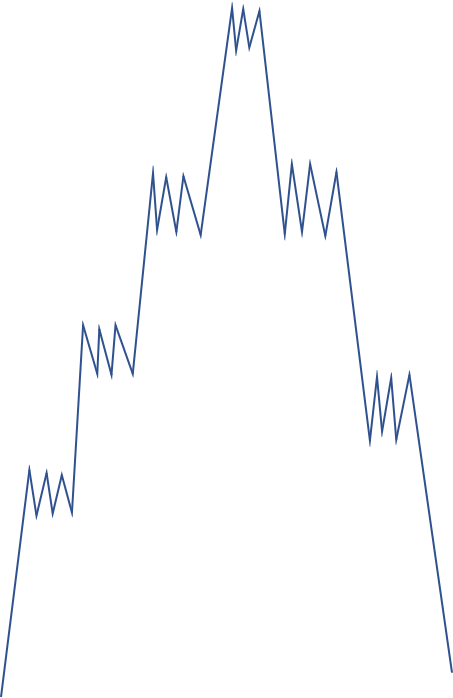
From these, we can begin to picture where to look on a chart, as below:
And finally, on a real life example, I've marked a few obvious flags.
This is but just one component of the tools we need to help shape the price story on a chart, and we'll revisit their importance in my next 2 articles, firstly about support and resistance, and secondly, about the significance of each flag.
There will be many flags that you can find on a chart. If you're serious about improving your chart reading, go ahead and open up a chart and start practicing to identify these areas. With enough practice, you'll be able to open up a chart and not see a tangled mess.
TIP - with flags, we mark the top of a previous candle high, and then the bottom of a subsequent low. We DON'T mark flags like this:
This is compression and tells us something completely different.
I am sure you will like(follow) my blog.