Daily Crypto Analysis - 19th Jan - Technical Analysis
Bitcoin
(Bitstamp:BTCUSD 1h)
After breaking downwards from the ascending channel and down through a shallower support, Bitcoin appears to have met temporary support around the $11160 level, which aligns with the 38.2% support of the recent movement.
Bitcoin has made a small double top here, so more bearish movement is looking likely in the near future, although we may see another bounce off this support beforehand.
At the very least I expect there to be a retest of lows before any strong bullish movement, but there may be fake-outs upwards prior to the next leg down. Keep an eye on the zone between the $12146 resistance and the $11068 support for high volume breakouts.
Ethereum
(Bitstamp:ETHUSD 1h)
As with yesterday, Ethereum is following Bitcoin's movements closely. There is the same breakout of ascending wedge and small double top. In the short term we appear to be finding good support above the $1000 level, which makes sense as a strong psychological zone.
As I recommended yesterday, keeping an eye of Bitcoin's movements will probably provide a better insight into ETHUSD movements than the ETHUSD chart, as Bitcoin is currently the driving force in the market.
(Bitstamp:ETHBTC 1h)
The ETHBTC ratio is staying within a very tight range at the moment, attesting to the high correlation of ETHUSD to the BTCUSD movement.
If we see another break downwards on Bitcoin, then historically we can expect further bearish action on the ratio. However, keep an eye for bullish divergence or strong support zones as possible areas for ETH to decouple from Bitcoin.
Bitcoin Cash
(Bitfinex:BCHUSD 1h)
Bitcoin Cash has been following a similar pattern to Bitcoin, with the notable lack of an obvious ascending channel. Instead we are currently in more of a symmetrical triangle formation (Although its fairly loose, so take with a pinch of salt).
Based on the bearish context, we would expect this formation to break downwards once Bitcoin starts its next leg down.
Keep an eye on the region above the $1343 for sharp retraces, as it is possible that we see a double bottom here, but that is just hypothetical for the moment.
(Poloniex:BCHBTC 1h)
On the ratio we're seeing another triangle formation, but this once has a more obvious downwards bias. Generally this would be considered a bearish continuation pattern, so we will likely see a break downwards when Bitcoin retests lows.
However, in the macro context, it would be wise to watch for bullish reversal signals such as a double bottom.
Disclaimer
I will do my best to give unbiased, objective analysis, but I can make no promises about my accuracy.
All posts are based on my personal opinions and ideas and do not constitute professional financial investment advice.
Thank you for sharing, @matthew-analyst
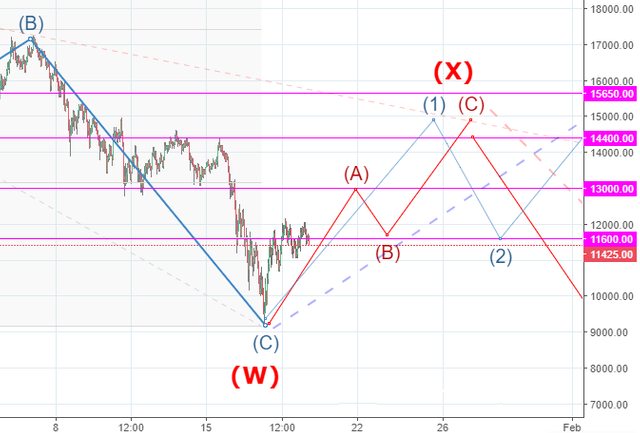
Here is my vision of Elliott waves regarding BTCUSD:
Thanks for sharing, I might include EW analysis in the future, once I've got the hang of it.