What Is Going on with the Steem Price?
As more and more people keep their eyes on the likelihood of a Bitcoin ETF, some of us here on Steem may be wondering what that means for Steem.
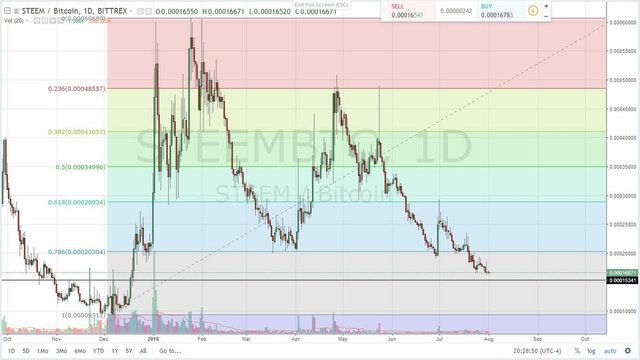
This chart is by no means an in depth study, it is a simple Fibonacci pattern from our most recent market cycle.
For my friends who do not know what a market cycle or a Fibonacci pattern is, don’t worry, we’ll break both of those down.
First off, I’ll give you a picture to compare our Steem chart to. The picture below is the Wall Street Cheat Sheet. Our friend, @old-guy-photos likely has plenty of experience with this and may give some helpful comments when he stops by.
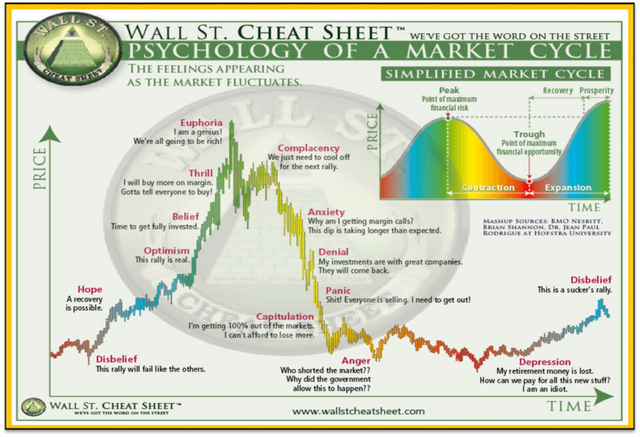
Do you see any similarities between the two pictures?
For those of us who were around in November and December, we can identify with the emotions of thrill and euphoria as Steem ran up over $8 or 60,000 satoshis as our chart shows. We may also see the emotions of denial and anger as Steem has hovered at the bottom with the rest of the market.
In essence, a market cycle is the wave of human emotion that we measure by the value any given asset has at one time.
When we couple those human emotions with the Golden ratios of Fibonacci numbers, a pattern begins to emerge.
When it comes to our Steem chart, know this, an 88.3% correction on a Fibonacci chart is a great sign for a price rise.
Just about every altcoin in crypto retraces to 88.3% of its initial value after a major jump in price, and finds a new base from there.
If you look at our chart above, roughly 15,341 satoshis is a full 88.3% Fibonacci correction. That black line at 15,341 is being tested right now as I write this article - I drew the chart last night.
Will be bounce from here? Maybe, there are no guarantees in the game of trading, and that is what makes it fun.
What I am saying, is that the likelihood to fall further is smaller than the likelihood to go up, and that bodes well for the dollar value of your posts and mine.
Image Source: 1
Actually, lydon, that wave pattern is the classical pattern of human emotions upon which I pattern my plot graphs - it's been around forever...well, ever since there were waves and people to notice them. As Hamlet says, as long as this machine is to us, it will keep going ie. as long as we are in the flesh in our bodily machines, this pattern will continue
"rise and fall and begin again, bringing the eternal note of sadness in...." LOL
I was waiting to hear the literary equivalent from you, lol. Shakespeare comes through for us again.
I have no answers, only questions and observations.
.png)
What the hell is that?
Read the last line on the screen shot. Or better yet go to that account and see it all for yourself.
I read it, but I don't really get it. But I'll check the profile as you say, see if I understand better.
Well Ned sends his money to this account and this account sends it out. Not always a good sign when the CEO is selling...
Well, shit!
That doesn’t look good.
Hey Lydon!
I have been shorting Steem and so far it has been working. I'm taking small bets with low TP %
I looked around your posts. Very cool! Check my posts out if you like I believe we will have similar approaches very so often.
Cheers!
Excellent analysis, congratulations and thanks for sharing.
Well we have seen the big rise now its all about seeing the downtrend for the long time the market emotions
I lost my crystal ball at the bowling alley... :O
😄😇😄

Thanks for sharing dear friend. Your post will add a little to the uncertainty that sometimes we have before the variation of market prices.