You are viewing a single comment's thread from:
RE: A Year of Synerio AMP Price Chart Analysis
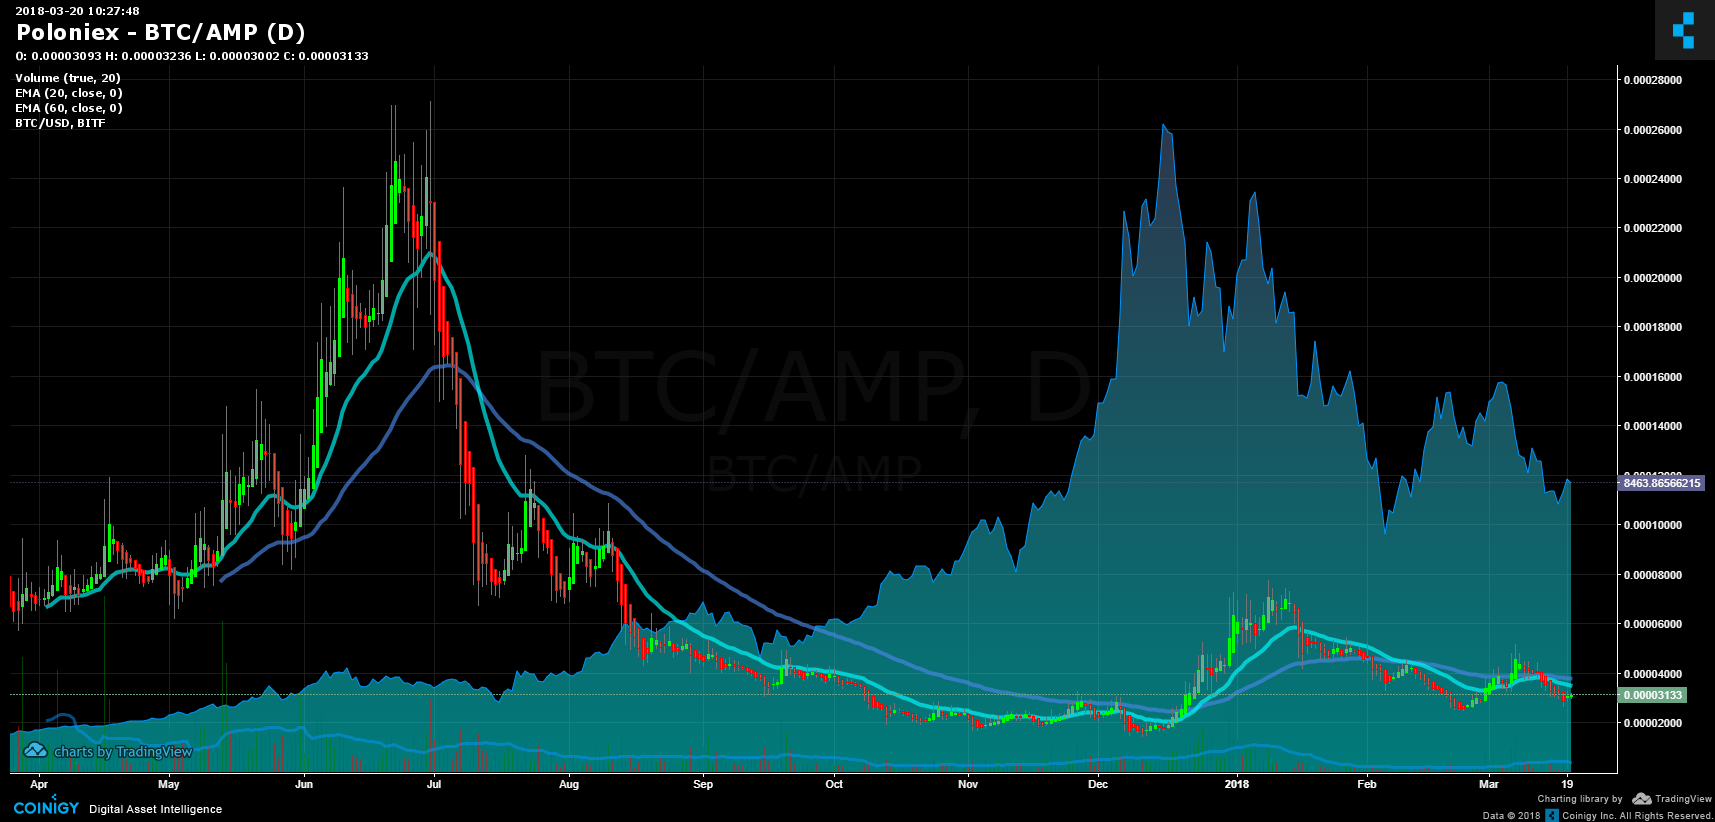
The one year daily chart of AMP shows prices at historical lows
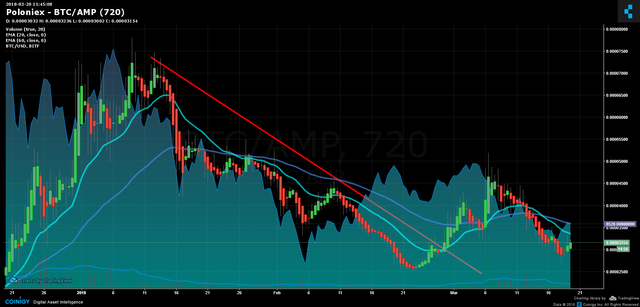
And the Three Month chart shows that we are within a potential 1-2-3 bottom and the down trendline was broken a short while ago - we are now watching for strength in prices and a cross over of the 3 month EMA
View more long term analysis reviews
ARDR - One Year ARDR Technical Analysis
BCN - One Year Bytecoin Technical Analysis Charts