A Year of Synerio AMP Price Chart Analysis
The purpose of keeping a cryptocurrency trading journal is to look back and study the correct trades and the incorrect trades - become aware of the typical mistakes, and become hyper aware of the best patterns and most successful case studies.
The markets are lining up into the formations that have been my most profitable, and it's time to study my trades and my AMP technical analysis predictions in order to quantify and classify my mistakes and successes.
Every couple weeks to a month, I create a technical analysis video using the charts on Coinigy so I can save a screenshot of the chart. Below is a screenshot of these charts, starting in April 2017 and progressing monthly until February of 2018 with an extended price prediction on the chart.
View the AMP Charts gallery on Imgur
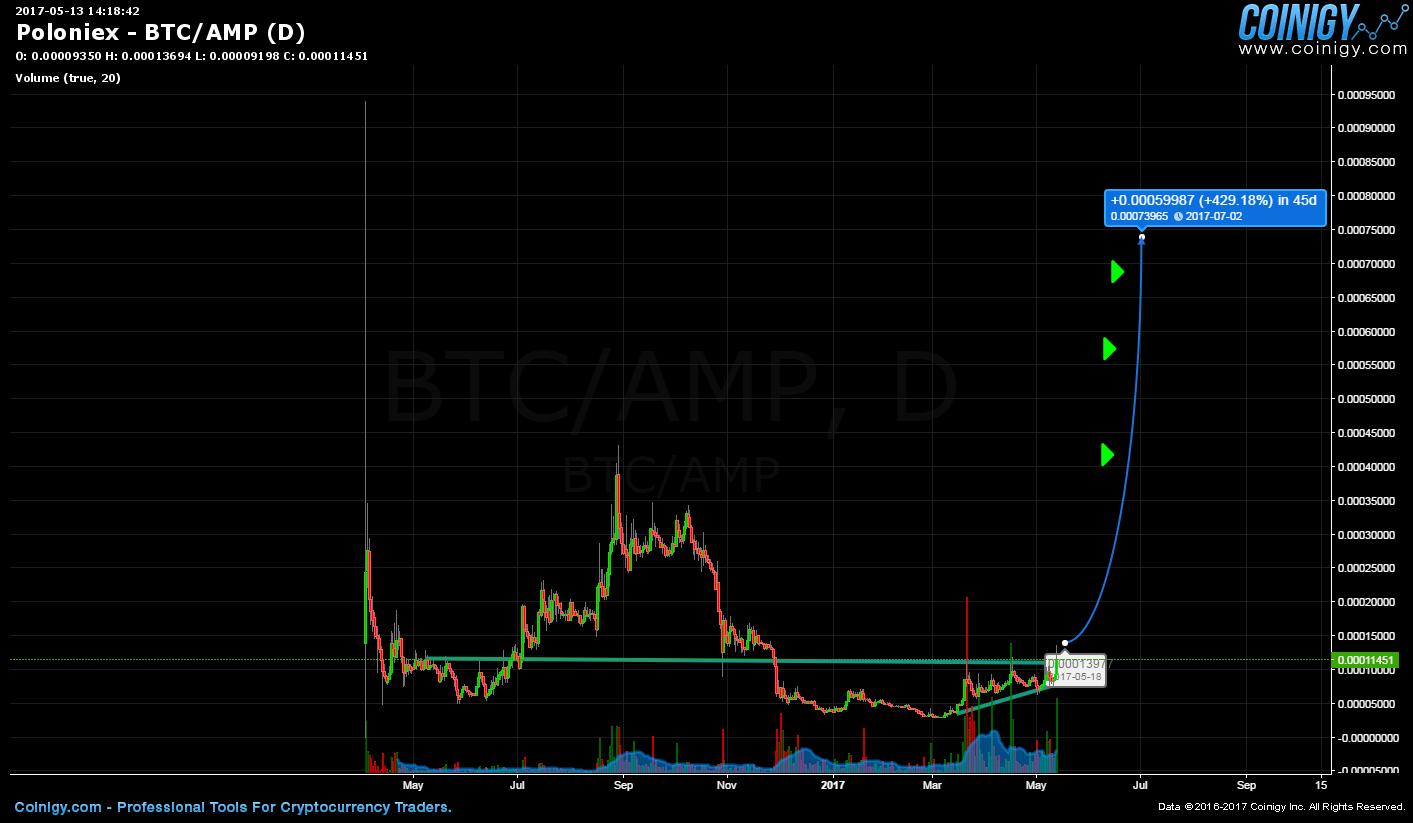
April 1 2017
Commentary from April 2017 with correct anticipation of a bull run, followed by monthly chart reviews. After taking profits in this market successfully in June and July, the anticipation of a continuation of a bull run was an error.

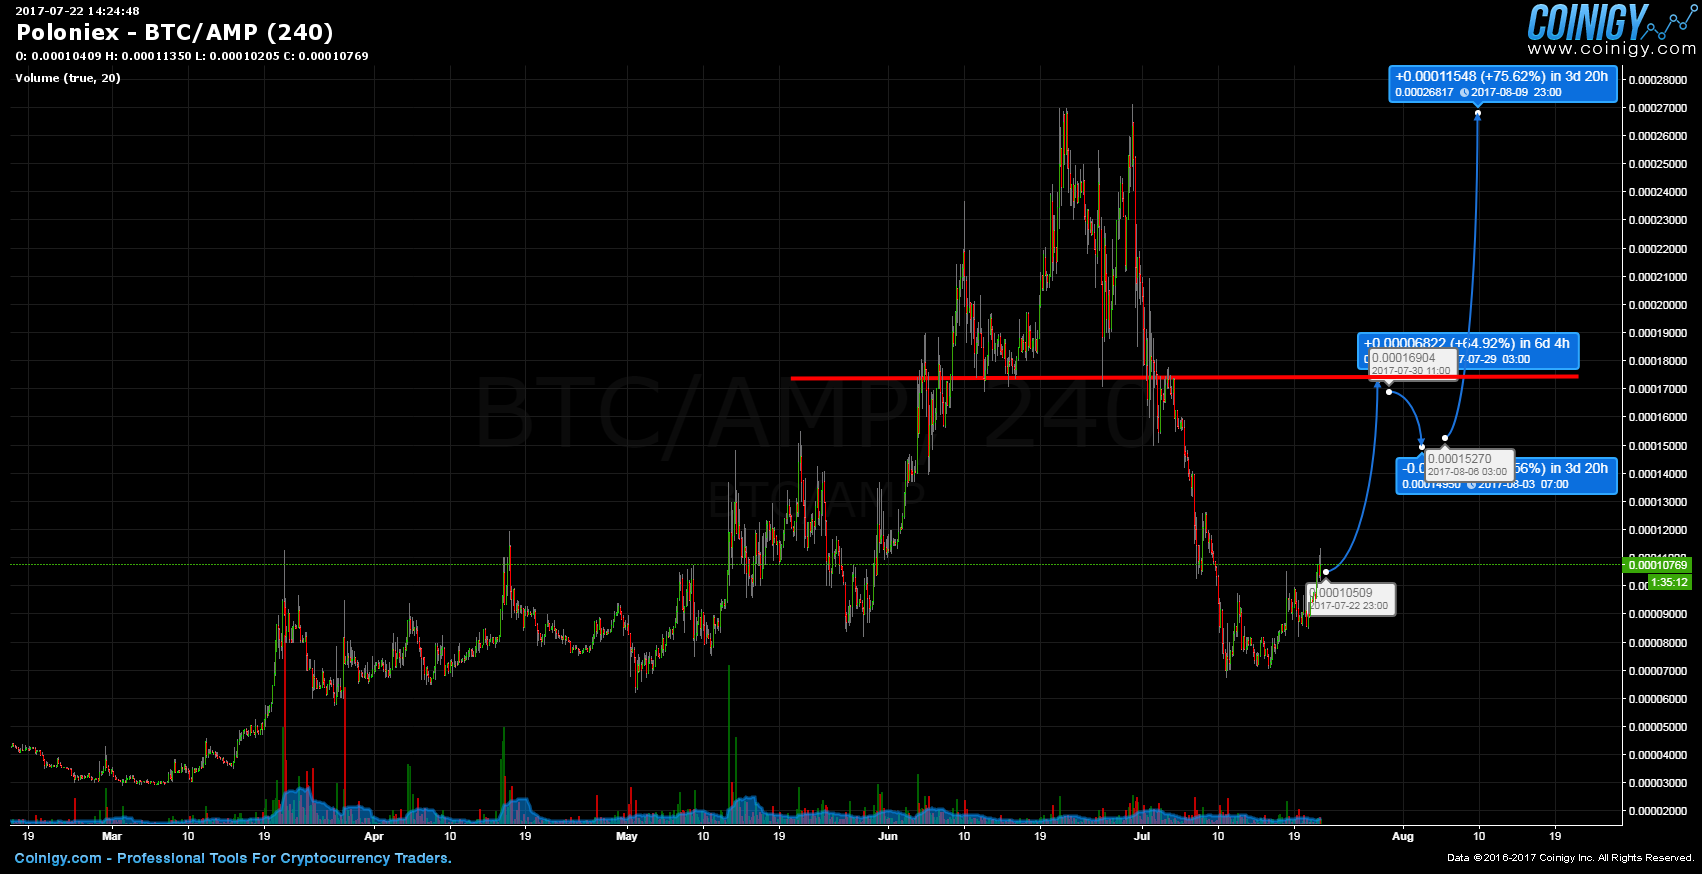
April 22 2017

May 2017
identified the 1-2-3 bottom break out and correctly predicting the bull run to come before the end of June
June 2017

July 2017
July 22 2017 after the peaks in June and the price crash back to May level prices, expecting a return of the bull that never came through the rest of 2017
August 5 2017
August 5 2017 correctly anticipated lower prices coming - but was still thinking the bull would be back.

August 26 2017
August 26 2017 - prices broke lower from July, now still expecting the return of the bull that never came for the rest of the year.

September 2017
September 14 2017 - not anticipating this market is ready to break higher from this point, searching through all Poloniex markets to find those that may match a bull signal

October 2017
October 30 2017 - observing the price trends generally matching bitcoin

November 2017
November 30 2017 - monitoring an actual 1-2-3 bottom in development from the end of October and building for the next six weeks - which later proved to be a fakeout breakout..

December 2017
New lows December 2017 - turned out to be a new #1 point and the turn around - this was the 'capitulation low' that took more than six months to play out after the tops in June of 2017

February 2017
February 2 2018 - a several month prediction of AMP prices moves to come

Conclusion
I made a fantastic profit trading AMP - inspite of the fact that I was wrong about the continuation of the bull market all along from August, September, October, November and December.
In reviewing the success of my own trading, I find the best success from March through till the end of June as the 1=2=3 bottom and the following bull market - and the 1-2-3 top formation that ended the run, were clear and matched the patterns I seek.

However, after the peak, and retrace in prices through july and august, I remain convinced that the alts would bull again, and every time bitcoin made a consolidation in the uptrend, it roughly matched the same time that alts made consolidations appearing like bottoms. Each time I was betting on alts, when, in hindsight, it would have been better to be holding bitcoin.
I made money inspite of myself through this time as the value of all the alts rose with the price rise in BTC.
Watch for more of these year-long reviews in the other markets on Poloniex. Case studies on cryptocurrency trading and technical analysis - provided by DigitalCurrencyTraders.com please read the terms
The one year daily chart of AMP shows prices at historical lows
And the Three Month chart shows that we are within a potential 1-2-3 bottom and the down trendline was broken a short while ago - we are now watching for strength in prices and a cross over of the 3 month EMA
View more long term analysis reviews
ARDR - One Year ARDR Technical Analysis
BCN - One Year Bytecoin Technical Analysis Charts