RE: Bitcoin/Ethereum analysis 07/11/2017
I think your C wave might be too short compared to A. Usually, an ABC correction has the C wave the longest by Fibonacci 1.5x or more of A. Using my BitFinex chart and prices, A length was $201; so at Fib 1.5x; C would be about $300. That means ETH at about $100 or so. Can Wave C possibly be shorter than A? Sure! But possibility is different from probability. IMHO
Can the bottom be now? Absolutely! However, Fib ratio can help gauge the range.
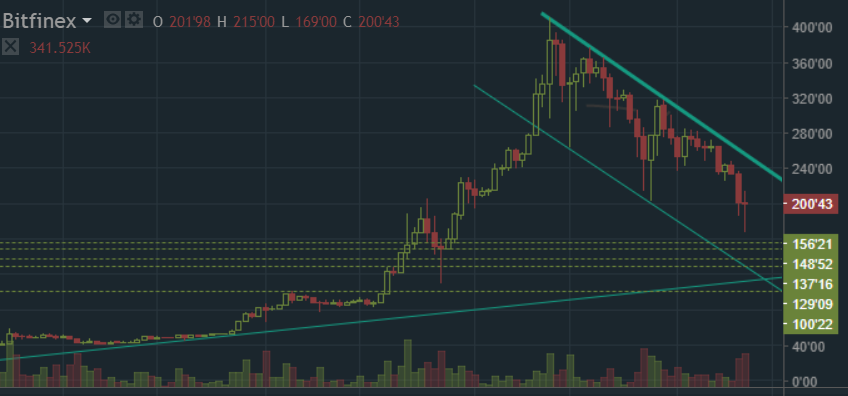
The bottom line of current channel also intersects the long support line at around $114.79
The dotted white lines represent my ladder entries already entered as buys and waiting to be possibly hit.
How often have you bought all your shares in one transaction only to see prices go lower and lower and lower? Laddering your entries prevents the emotional pain by reserving gun powder to buy at lower prices.
Also, you can enter your ladder entries and basically walk away. You need not be glued to your monitor. If the entries get hit...great! If not, no worries.
This buying tactic allows the same for selling. You ladder your profitable sales.
My analysis is about BTC/ETH, not ETH/USD. Its not the same chart. Which chart are you referring?