Bitcoin/Ethereum analysis 07/11/2017
Is correction over?
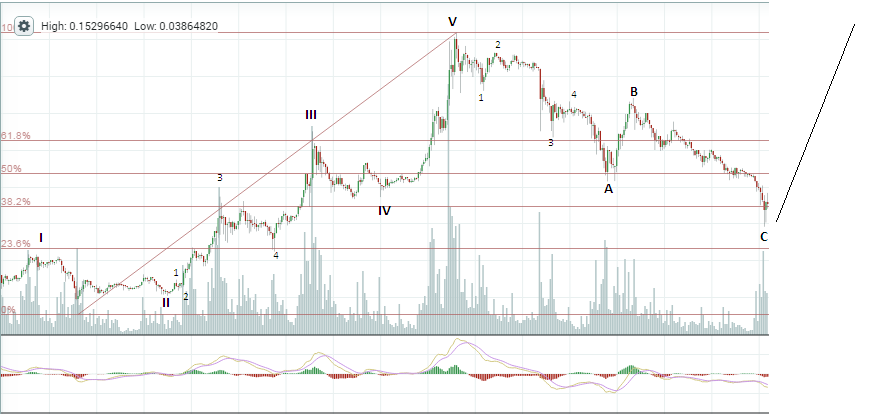
I've been following closely Bitcoin/Ethereum price action. Since April 24 price went up in five impulsive waves, from 0.0381 up 0.1529, or 201% increase. Since then, there was a correction in three waves (A, B, C). I have been calling since June 1st to wait for the next wave low to establish new longs. As expected, price tested 61.8% retracement, which is a good buying opportunity, or diversifying for investors who are exposed to bitcoin only.
On medium to long term, I'm more bullish on Ethereum than Bitcoin (although I own both). I think Ethereum has more potential than Bitcoin because of new improvements we expect to have, from Metropolis the next 2-3 months and Ice age to Casper. Bitcoin is a great currency, the first and the safest. I dislike with bitcoin community, most of them are putting their personal interest in front of the future of bitcoin.
Chart: BTC/ETH
Please check my previous post and chart:
https://steemit.com/cryptocurrency/@ctyptouniverse/bitcoin-ethereum-analysis-07-08-2017
https://steemit.com/cryptocurrency/@ctyptouniverse/bitcoin-ethereum-elliott-wave-analysis-jul-01-2017
Chart: posted 07/01/2017
Disclaimer: The information contained herein is not guaranteed, does not purport to be comprehensive and is strictly for information purposes only. It should not be regarded as investment/trading advice.
No, it's not over yet.
Lets wait and see :)
If wave V completed, then current correction is a Wave 2 down. EW rule shows that wave 2s can retrace 50% to 99% of the prior five waves and still be a valid correction. However, fibonacci usually puts wave 2 retrace first stop at 50% and then 61.8%. So, probably, more down to go...perhaps $114.
This chart is BTC/ETH not ETH/USD.
I think your C wave might be too short compared to A. Usually, an ABC correction has the C wave the longest by Fibonacci 1.5x or more of A. Using my BitFinex chart and prices, A length was $201; so at Fib 1.5x; C would be about $300. That means ETH at about $100 or so. Can Wave C possibly be shorter than A? Sure! But possibility is different from probability. IMHO
Can the bottom be now? Absolutely! However, Fib ratio can help gauge the range.
The bottom line of current channel also intersects the long support line at around $114.79
The dotted white lines represent my ladder entries already entered as buys and waiting to be possibly hit.
How often have you bought all your shares in one transaction only to see prices go lower and lower and lower? Laddering your entries prevents the emotional pain by reserving gun powder to buy at lower prices.
Also, you can enter your ladder entries and basically walk away. You need not be glued to your monitor. If the entries get hit...great! If not, no worries.
This buying tactic allows the same for selling. You ladder your profitable sales.
My analysis is about BTC/ETH, not ETH/USD. Its not the same chart. Which chart are you referring?
Since no one knows where the true bottom is (anyone who says they do is a liar); I have been laddering into ETH. I have lower entry ladders at $156.21; $148.52; $137.16; $129.09; $100.22
Last night my higher ladder entries were executed at $182.40 and $172
Laddering the entries using below supports allows emotional calm. As I have powder to buy, it actually makes me elated to see lower prices that would fill my lower ladders.