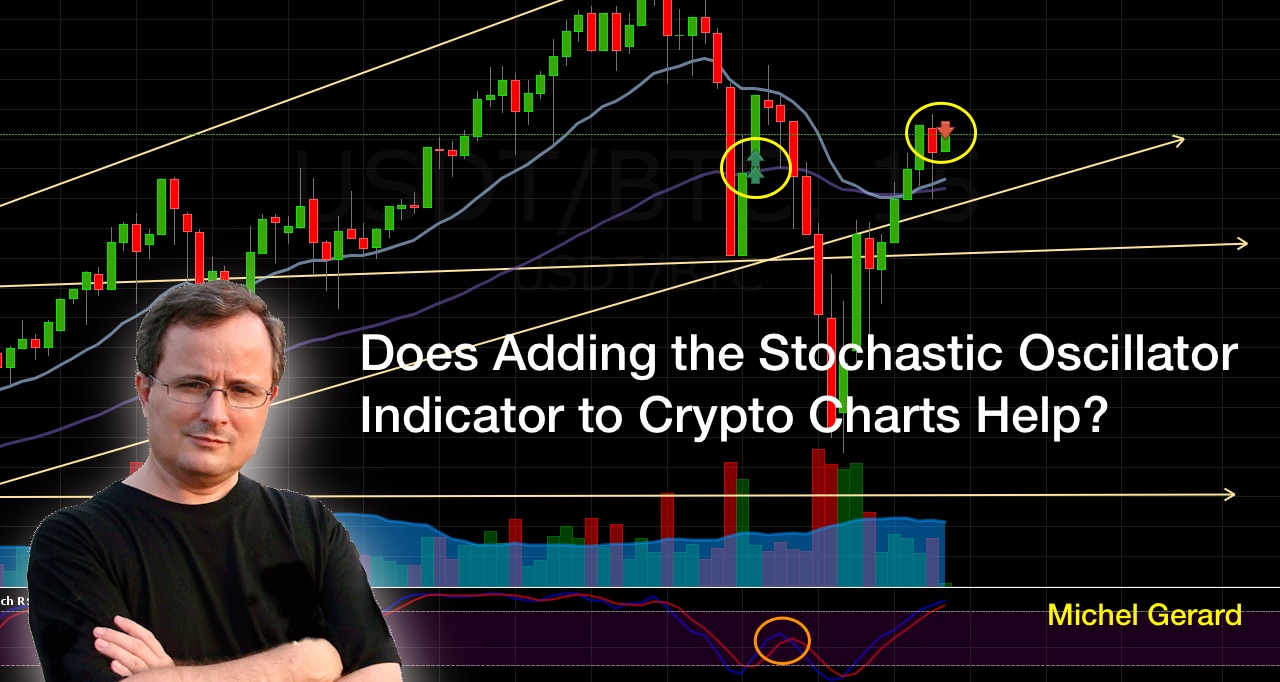
Does Adding the Stochastic Oscillator Indicator to Crypto Charts Help?
I have just added the Stochastic Oscillator to my crypto trading charts to see if they could be of any help and this is what I found out making two trades with it.
I use Coinigy to look at charts and place trades, if you would like to try Coinigy please use my referral link https://www.coinigy.com/?r=842aeb1c because I will get $15 if you purchase later on.
Does Adding the Stochastic Oscillator Indicator to Crypto Charts Help?
The Stochastic Oscillator RSI is combined of two very popular technical analysis indicators, which are Stochastics and the Relative Strength Index (RSI).
This is what Wikipedia is saying.
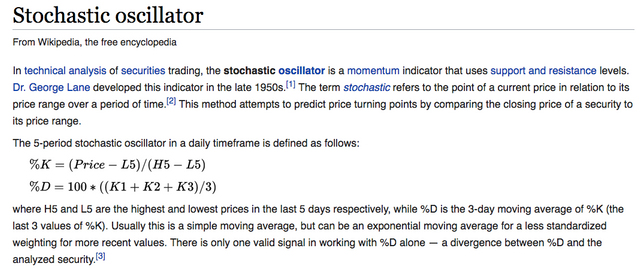
Read all details on Wikipedia: https://en.wikipedia.org/wiki/Stochastic_oscillator
Basically, you can see on the Stochastic Oscillator RSI when a crypto is overbought or oversold and it can be an indication for the crypto trader to buy or to sell.

If the lines go over 80, it is overbought and you should sell on its way down. If the lines go under 20, it is oversold and you should buy on its way up.
Now let's see if that worked for 2 trades I've made with the USDT/BTC pair.
USDT/BTC Trades using the Stochastic Oscillator RSI.
First trade on Poloniex
For this first trade on Poloniex, I bought BTC when it was under the 20 line and oversold.
I bought a bit late on the second green candle, but that was a confirmation that it was going up, the moving averages were in a flat trend.
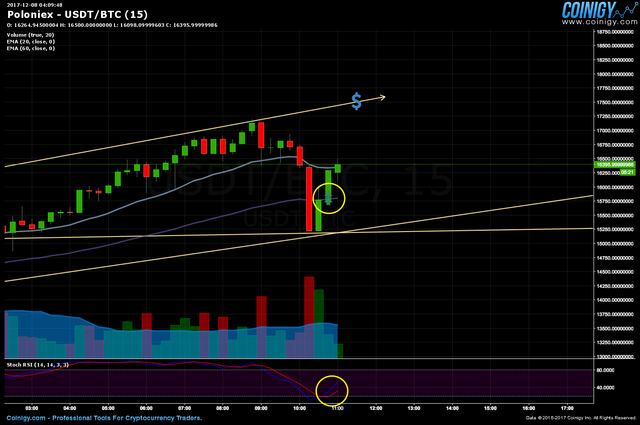
So you might be thinking that with the theory I explained earlier, this should go up right?
Let's see what happened.
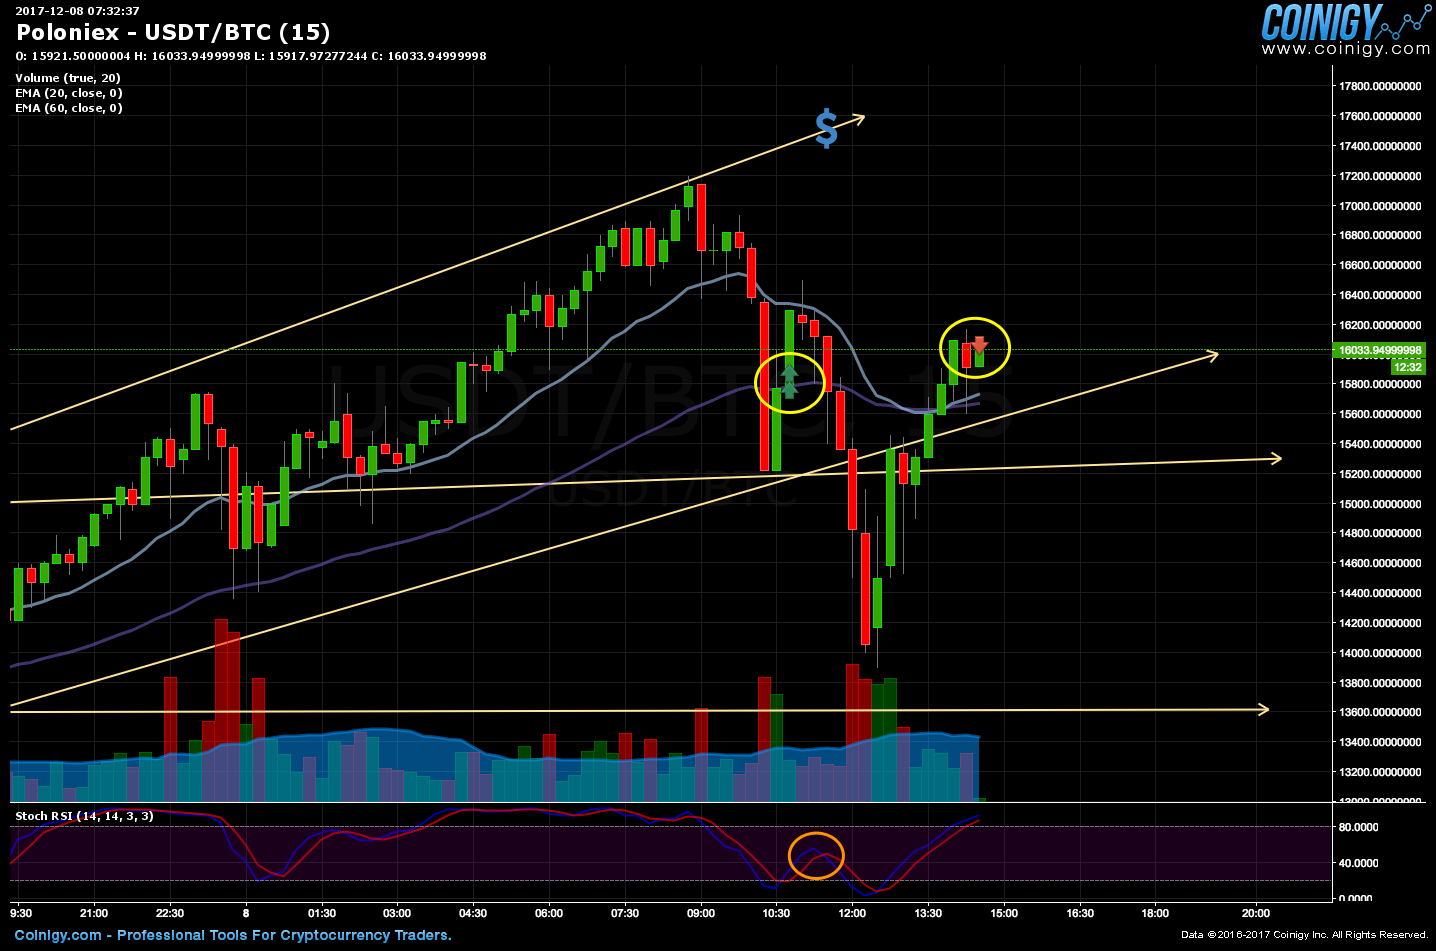
It did go up, but as you can see on the Stochastic Oscillator RSI it stopped midway, not going over the 80 line and being overbought. It went down instead under the 20 line, which is oversold, and then proceeded this time up again and reached the 80 line where I sold.
Before placing this trade I looked at the history of the Stochastic Oscillator RSI on the chart and it constantly went from under 20 to over 80, without stopping midway as it did.
That's another lesson, hopefully the trade was still profitable.
Second trade on Cryptopia
For this second trade on Cryptopia, I bought BTC when it was under the 20 line and oversold.
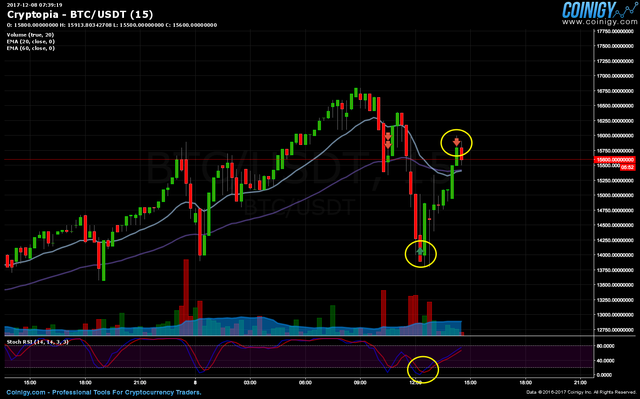
This time it didn't stop midway, but went straight up over the 80 line where I sold. I could have waited a little bit more that the lines went down 80 to sell, but I was eager to prove that this works with a second profitable trade.
This blog post is my trading journal on my way learning how to trade cryptocurrencies. I am a student of the Cryptocurrency Trading Course by Digital Currency Trader that you can join to learn with me. Use my special discount coupon code "michelsentme" at check out, I will get a small commission and you will get a 20% discount.
I hope that sharing this with you is useful.
In conclusion, I have learned that the Stochastic Oscillator RSI is very useful to know when to buy or sell, combined with the moving averages showing the trend. I also learned that they don't necessarily go from under 20 to over 80, and that they can change direction midway, indication that the market is not overbought or oversold at that particular moment.
Would you upvote this post and follow me for more because this will encourage me to make more posts about cryptocurrency trading like this one?
Michel Gerard
yes now bitcoin up now price $14848, thanks for sharing your update information.
Good news, I was waiting for that as I had some opened trades in btc.
You have trading charts! I have the idea of taking some of my steemit bounty - opening a bunch of coins with small amounts, and playing the pumps and dumps. I think I can do it in this volatility and my son is interested and better then me at this type of thing. What do you think? Now I know who to get advice from :)
Yes, that's a good idea. I only started with $150 on Poloniex, I then bought a course and experiment every day with small amounts. I am feeling more confident now. Use Coinigy, that's the best tool out there.
Thank you! On my list :)
you are a forex trader and cripto trader, right?
resteemed this post.you can check timeline @gmichelbkk
Only crypto at the moment. Thank you for your comment.
Thanx you so much Dear @gmichelbkk . for sharing this is useful.pecial Discount Coupon Code >>>>michelsentme<<<<,
I'm glad it is useful.
thnx you dear .
Thanx you sir @gmichelbkk for this useful post sharing . & you always share Gd .
My pleasure. I'm glad you like it.
thnx you sir . i want talk with you .
It's interesting! It helps to make better decision. Thank you for bringing new tools and showing your analysis.
I'm glad it is useful. There are so many indicators that it's important to choose the ones that are less confusing and most useful.
This post has received a 3.67 % upvote from @buildawhale thanks to: @gmichelbkk. Send at least 1 SBD to @buildawhale with a post link in the memo field for a portion of the next vote.
To support our daily curation initiative, please vote on my owner, @themarkymark, as a Steem Witness
Congratulations @gmichelbkk! You have completed some achievement on Steemit and have been rewarded with new badge(s) :
Click on any badge to view your own Board of Honor on SteemitBoard.
For more information about SteemitBoard, click here
If you no longer want to receive notifications, reply to this comment with the word
STOP