3 Main Kinds of Cryptocurrency Charts
There are 3 main kinds of cryptocurrency charts that are used to analyze market trends and crypto prices: line charts, bar charts and candlestick charts. In this blog post, I'm going to show you what they are.
3 Main Kinds of Cryptocurrency Charts
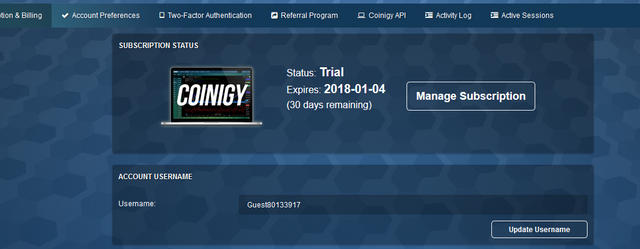
I use Coinigy for the 3 kinds of charts I am showing you below, if you would like to try Coinigy please use my referral link https://www.coinigy.com/?r=842aeb1c because I will get $15 if you purchase later on.
Line charts
Line charts are the most basic used for cryptocurrency charts. They are mainly used by everyday long term investors.
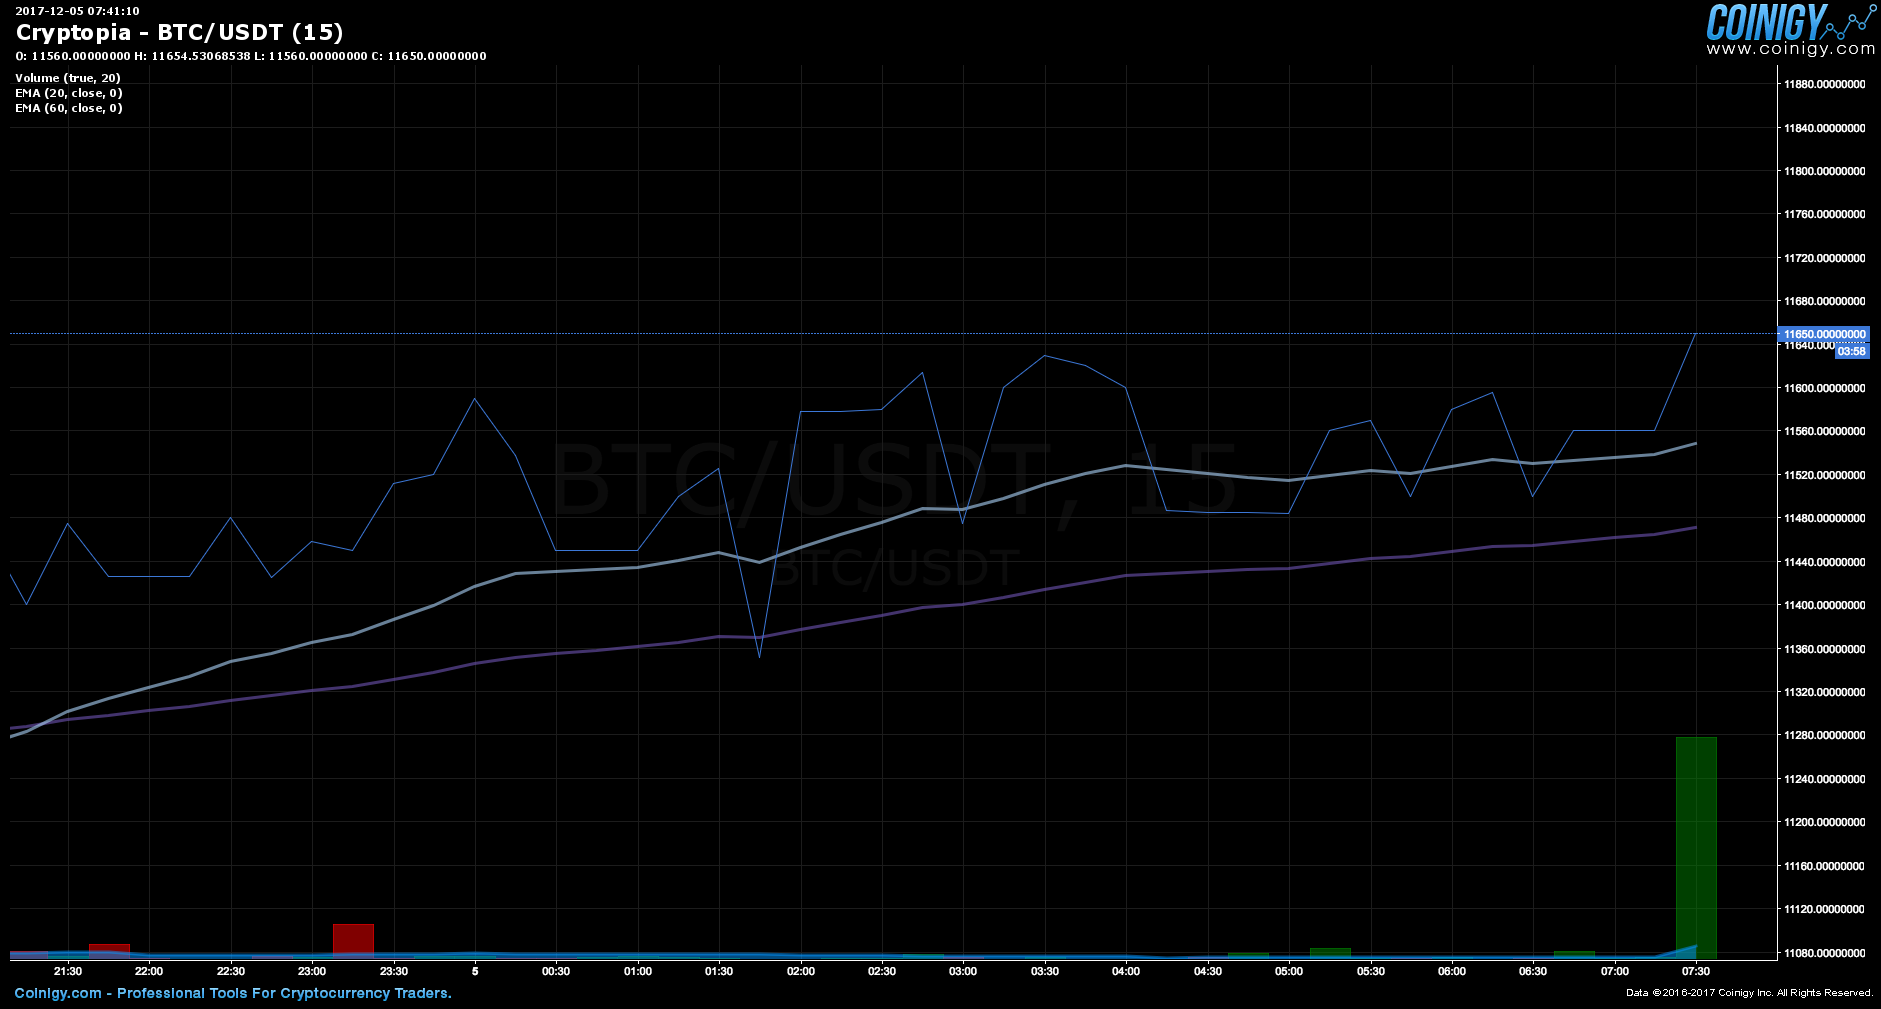
They are composed of points connected by a line to form a Line chart. The points are the closing price of a specific time frame. In the example above, it is a 15 minutes time chart, which is identical to the other kinds of charts I'm going to show you, but you mostly have longer time frames for line charts.
This is a 3-month Line charts.
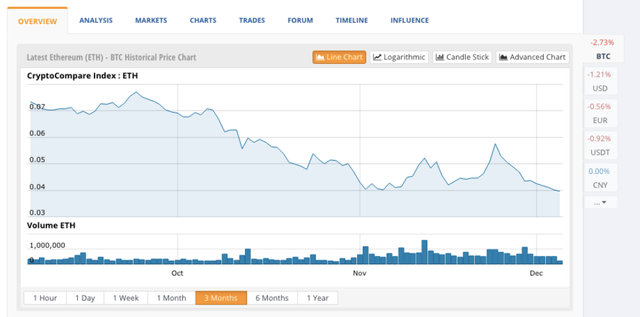
Investors can see clearly the trends of the market and the value of the cryptocurrency, in this case ETH versus BTC.
The line chart is not very useful for day traders and position traders because the information given by the Line chart is very limited.
It only gives one price value, which is the closing price. You can't see the opening price, the high price and the low price in a Line chart.
Bar charts
Bar charts are more useful to cryptocurrency traders and investors around the world. They are made of vertical lines and small horizontal dashes.
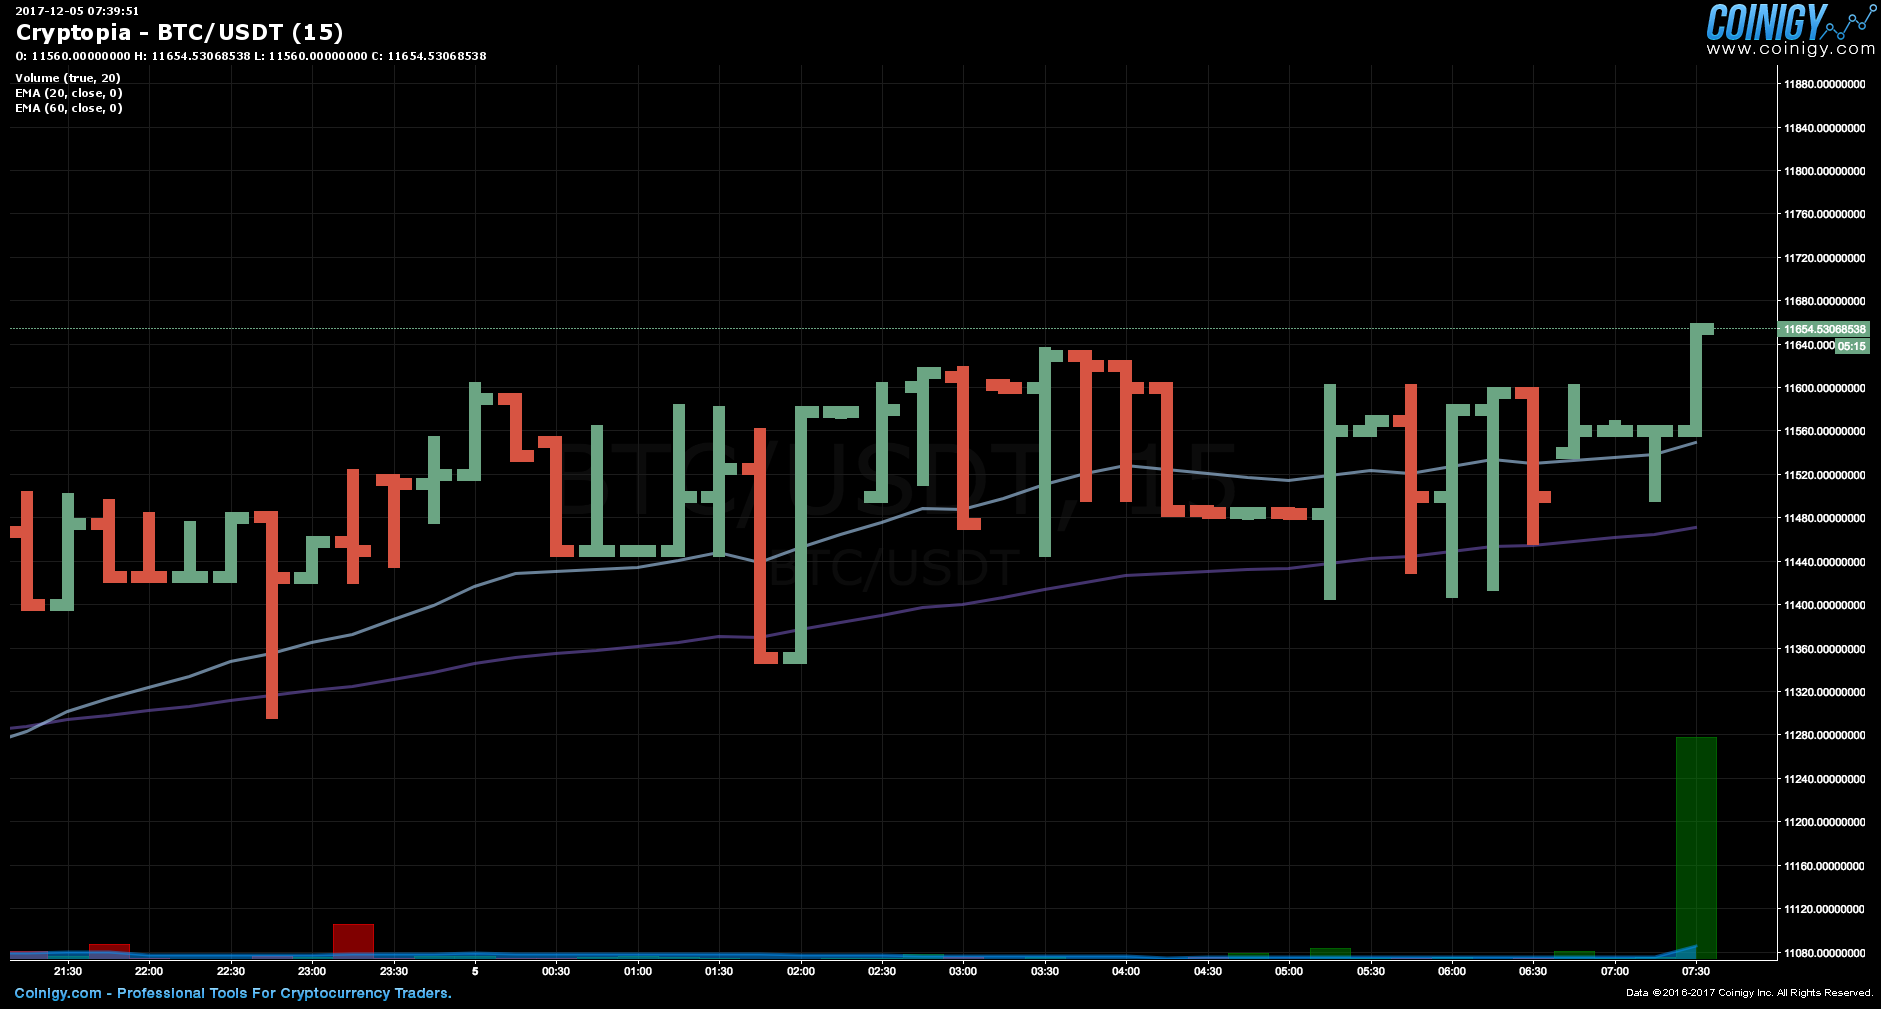
In Coinigy the bars are green or red, but usually they are unicolor.
The highest point of the vertical line represents the high price and the lowest represents the low price of a specific time frame.
The dash at the left represent the opening price and the one at the right represent the closing price of a specific time frame.
A Bar chart includes 4 important values that are useful for traders: high price, low price, opening price and closing price.
I believe that you are not very familiar with the Bar chart and that what you are used to see for trading cryptocurrencies are the Line chart and the Candlestick chart that I am going to show you now.
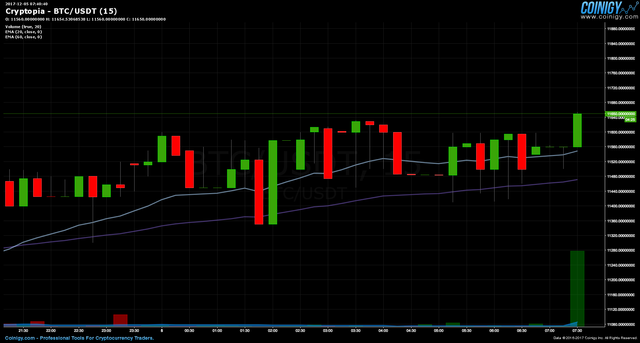
Candlestick charts
Candlestick charts are in my opinion the most used charts for trading cryptocurrencies, but traders and investors have very little knowlege on how to understand what exacly the candlesticks are saying.
If you are like me who have used them for a long time, a green candlestick meant it's bulish, a red candlestick meant it's bearish, and that's all. I am now learning more about candlesticks and what they can say is amazing.
Did you know that there are more than 150 candlestick signals and patterns?
Maybe I will make a post or several posts only about candlesticks later.
Bar charts and Candlestick charts are very similar, but the difference is in the body of the chart. When you connect the opening and closing price a box is formed. If the closing price is higher than the opening price the candle is green and if the closing price is lower than the opening price, the candle is red.
The size and color of the body, the length of the shadows are very important to indicate current trends, reversals and future price movements.
I am a student of the Cryptocurrency Trading Course by Digital Currency Trader that you can join to learn with me. Use my special discount coupon code "michelsentme" at check out, I will get a small commission and you will get a 20% discount.
Would you upvote this post and follow me for more because this will encourage me to make more posts about cryptocurrency trading like this one?
Michel Gerard
i prefer the line one
thnx
Thank you very much @yassine04 for your comment and telling us what you prefer.
This post has received a 5.39 % upvote from @buildawhale thanks to: @gmichelbkk. Send at least 1 SBD to @buildawhale with a post link in the memo field for a portion of the next vote.
To support our daily curation initiative, please vote on my owner, @themarkymark, as a Steem Witness
This post has received gratitude of 3.10 % from @appreciator thanks to: @gmichelbkk.
Informative post again, ty and wish you a nice day...
Thank you very much @artbenow, I am glad you like the post.
Nice explanation!
Looking forward to reading your post about about candlesticks.
Thank you for reading the post and commenting.
Wont it be profitable to convert crypto into some currency with lower market capacity????????? bitcoins are making so mucg progress right now all for what coz it has only 21 million market cap max... if u invest into something into even lower market cap then today or tomorrow u can make way more money
Thank you very much for sharing your feedback here with us.
your welcome sir...Well i have invested sm 1000$ in monero few days back and it went up by 14% today...Now m planning to convert to sm ethereum what do u think will it be a gud deal?
I don't give trading advice as it could be a good or a bad deal. This all take study before any move.
Ohkay thanx for the advice bro... ur blog is doing really well keep up :)
i join complete your link
That's great. Enjoy your trial.
now i use trail
Fantastic!
this is very informative! Good for newbies like me~
I am glad you like it. Thank you for commenting.