Analysis: A Significant Ethereum to Bitcoin Price Chart.
The price of Ethereum largely recovered from this week’s flash crash. Some call it a sell off in a secular bull market, others call it buying the dip. We call it: strong fundamentals, and by that we mean that the price surge is justified by demand driven dynamics. Because of that we stick to our long term Ethereum forecast of $1000.
Talking about fundamental strength in Ethereum, it is interesting to apply traditional relative strength ratios to cryptocurrencies. When analyzing traditional markets we look at the gold to silver ratio to identify which of the two is outperforming or to understand whether a bull market has started or ended. In stock markets the S&P 500 to Russell 2000 ratio is popular as a gauge of risk (the small cap Russell typically outpeformers when investors are in ‘risk on’ mode).
When it comes to cryptocurrencies the most popular way among analysts is to compare market caps. While that is a good indicator it is not the most valuable one in our view.
What really is valuable as an indicator is the price ratio, for instance the Ethereum to the Bitcoin price ratio. The reason why we prefer this ratio above a market cap comparison is that, bottom line, whatever the market cap, all that matters is price. The point is that price reflects supply and demand factors; price is the point where supply and demand find equilibrium.
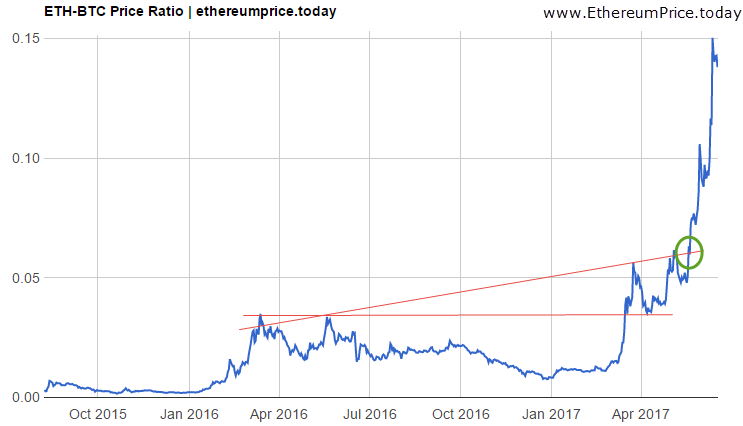
The Ethereum to Bitcoin price ratio is shown on the following chart:
This ratio reveals a very interesting insight. In March of this year, Ethereum’s relative strength moved to an “all-time high” right when it crossed the horizontal red line annotated on the chart. In chart analysis terms we call it a “breakout.” As goes with most breakouts it tends to come back down to test the breakout point before moving higher as of that point. That is called a “confirmation of the breakout” so it suggests that the uptrend will continues.
Continue Reading Here
https://www.cryptocoinsnews.com/analysis-significant-ethereum-bitcoin-price-chart/


It recovered partially at the third day of the dip, with a nice bullish candlestick. It's now in a consolidation phase, so is bitcoin. However, the ETH RSI peaks are to the downside, so I'm expecting a greater dip this week, probably down to $200.
That would be awesome for loading up. I don't think it goes that low though. Then again, my technical analysis chops are nada. Just going from the gut when I say I don't think it goes down that low again.
I agree and ig the hard fork for bitcoin continues to outrage more and more of the community then Etherum. could experience a flash rise well over 1k. This is very possible soon. I'm going to do a blog about this issue in the next couple days
Interesting blog. Interesting to see I'm not the only one that is thinking about this. The cryptospace definitely feels a bit inflated. However we also said that about the S&P 500 40 years ago Does anyone know about: https://www.coincheckup.com They give great insights in the team, the product, advisors, community, the business and the business model and other techincal insights. See: https://www.coincheckup.com/coins/Bitcoin#analysis To see the: Bitcoin Detailed analysis