Quarterly Cryptocurrency and ICO Market Analysis (Q2 2018)


This report presents data on cryptocurrency and ICO market changes during 2018. Special emphasis has been placed on an analysis of the changes that took place in the second quarter of 2018.
Information as of July 2, 2018
Professor Dmitrii Kornilov, Doctor of Economics, Member of the Russian Academy of Natural Sciences, and Leading Analyst at ICOBox
Dima Zaitsev, PhD in Economics, Head of International Public Relations and Business Analytics Department Chief at ICOBox
Nick Evdokimov , Co-Founder of ICOBox
Mike Raitsyn , Co-Founder of ICOBox
Anar Babaev , Co-Founder of ICOBox
Daria Generalova, Co-Founder of ICOBox
Quarterly Cryptocurrency Market Analysis (Q2 2018)
1. General cryptocurrency and digital assets market analysis (by month, quarter). Market trends.
1.1. General cryptocurrency and digital assets market analysis (by month).
1. General cryptocurrency and digital assets market analysis (by month, quarter). Market trends.
1.1. General cryptocurrency and digital assets market analysis (by month).
Table 1.1. Trends in capitalization of the cryptocurrency market and main cryptocurrencies from January 1, 2018, to July 1, 2018
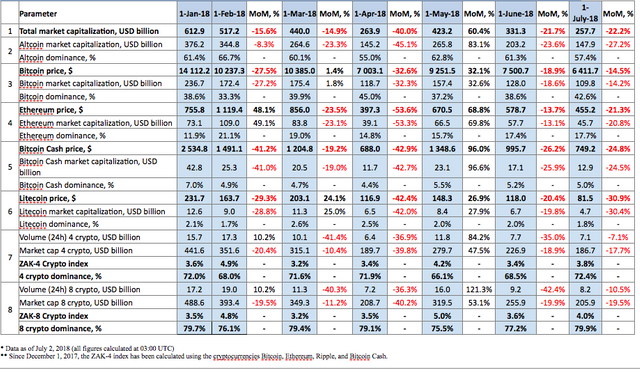

During the first quarter of 2018 cryptocurrency market capitalization was more than halved, and as of 03:00 UTC on April 1, 2018, equaled $263.9 billion (see Table 1.1, fig. 1). In the second quarter of 2018 capitalization dropped to $257.7 billion. Capitalization increased by 60.4% during April, but fell by 21.7% and 22.2% in May and June, respectively.
The dominance of the four and eight largest cryptocurrencies as of 03:00 UTC on July 1, 2018 equaled 72.4% and 79.9%, respectively, which is nearly the same as at the start of the year. However, their rankings have changed.
Bitcoin dominance decreased from 45% to 42.6% during the second quarter (see Table 1.1), i.e. one can conclude that altcoins depreciated less drastically in April-June than the leader of the cryptocurrency market.
During the second quarter cryptocurrency market capitalization fluctuated from $471 billion (max) to $232 billion (min) (Fig. 1a), i.e. within a range of $239 billion. For its part, bitcoin capitalization fluctuated from $169 billion (max) to $100 billion (min), i.e. within a range of $69 billion.
The most significant changes in the amount of cryptocurrency market capitalization during the second quarter of 2018 are shown in fig. 1a. These changes were related to numerous events (see the comments below and Table 1.4).
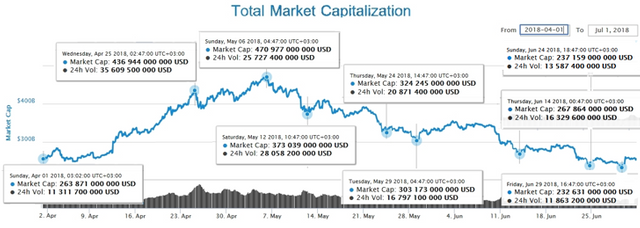
Figure 1a. Cryptocurrency market capitalization since April 1, 2018
Figure 1b shows bitcoin capitalization (red line) superimposed on cryptocurrency market capitalization (blue line). There is a very high correlation between the lines, in fact they correspond almost exactly, i.e. the bitcoin price determines the direction of price movements for most altcoins and is their “unit of account”.
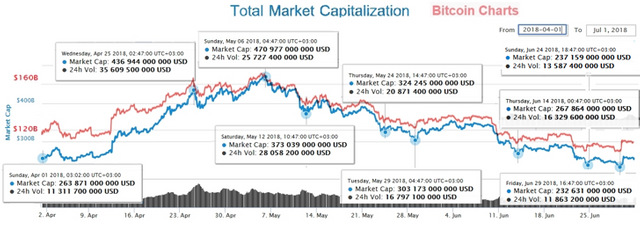
Figure 1b. Capitalization of the cryptocurrency market (blue) and bitcoin (red) since April 1, 2018
The individual reasons for the increase and decrease in the size of the cryptocurrency market in the second quarter of 2018 are given below in chronological order:
Increase in capitalization during the period from April 1 to May 6, 2018
- The Huobi cryptoexchange began its work in South Korea (April 2, 2018).
- The South Korean capital Seoul considers the possibility of issuing its own cryptocurrency (April 4, 2018)
- Lael Brainard announced that the US Federal Reserve does not consider cryptocurrencies a threat (April 5, 2018)
- The Monex brokerage firm purchases the Coincheck exchange for $33 million (April 6, 2018)
- A blockchain investment fund worth $1.6 billion was launched in China (April 9, 2018)
- 22 European countries agree to partner in developing blockchain technology (April 11, 2018)
- Mufti Muhammad Abu Bakar, a Sharia law expert, recognizes bitcoin as “halal” (April 13, 2018)
- UAE adopted a plan for strategic development of blockchain technology (April 13, 2018)
- Japanese cryptoexchanges begin self-regulation (April 24, 2018)
- NASDAQ is ready to become a cryptocurrency exchange (April 25, 2018)
- Malta approved three draft laws on blockchain and cryptocurrencies (April 26, 2018)
- CBOE announced record trading volumes in bitcoin futures (April 27, 2018)
- The Chinese cryptoexchange Huobi issues a $1 billion blockchain fund (May 3, 2018)
- The largest investment bank Goldman Sachs launches a service for trading in bitcoin futures (May 3, 2018)
- JPMorgan Chase patents a blockchain solution for intrabank payments (May 4, 2018)
Decrease in capitalization, May 7-28, 2018
- Japan strengthens the rules for cryptocurrency exchanges (May 7, 2018)
- In the opinion of analysts from the San Francisco Federal Reserve, bitcoin futures were the reason for the price collapse in December 2017 (May 7, 2018)
- Another 8,200 bitcoins are moved from Mt. Gox wallets (May 11, 2018)
- The Financial Supervisory Service (FSS), South Korea’s key financial regulator, joined the audit of the activity of Upbit, the country’s largest cryptocurrency exchange (May 16, 2018)
- The Indian authorities introduced an 18% tax on cryptocurrency transactions (May 23, 2018)
- Litigation connected with the bans of the Reserve Bank of India (RBI) on the services of cryptocurrency exchanges is underway in India [3];
- On May 24 the Monetary Authority of Singapore (MAS) demanded that eight of the country’s cryptocurrency exchanges refrain from facilitating trade in digital tokens that are securities or futures contracts without MAS’ authorization [5];
Britain’s Financial Conduct Authority (FCA) will audit the activity of 24 cryptocurrency companies to “determine whether they might be carrying on regulated activities that require FCA authorization” [6]; - South Korea begins an investigation into ICOs [7], despite reports by The Korea Times that the financial authorities were preparing a plan aimed at allowing initial coin offerings. You will recall that back in September 2017 all ICOs were banned in the country, but this did not stop local startups from collecting funds.
Decrease in capitalization, June 11-29, 2018
- The South Korean cryptoexchange Coinrail was hacked on June 10. Around KRW 40 billion (nearly $37 million) were lost.
- A group of hackers stole Ethereum worth more than $20 million from wallets and mining applications on the Ethereum platform (CoinDaily, June 12, 2018).
- Pursuant to a report from СoinDesk, a group of Chinese hackers made $800,000 from illegal mining of the cryptocurrency Siacoin (local media dated June 16, 2018).
- The Central Bank overseer, Bank for International Settlements, believes that cryptocurrencies may “break” the internet due to the need to process colossal volumes of data (June 18, 2018)
- The cryptocurrency project Turcoin was organized like a financial pyramid. According to the data of AMBcrypto, its participants may lose around $1 billion Turkish lire, or $212 million (June 19, 2018)
- The South Korean cryptoexchange Bithumb suffered a hacker attack. More than $31 million in cryptocurrencies were stolen from the platform as a result of the attack (June 20, 2018)
- That being said, the impact of informational factors on the sharp fluctuations in cryptocurrency market capitalization was not as pronounced in the second quarter as in previous periods. The process of cryptocurrency price manipulation as a result of the actions of market “whales” is making itself felt to a greater degree.
Price changes during Q2 2018 among the leaders of the cryptocurrency market
Table 1.2 shows the price change for 10 cryptocurrencies during Q2 2018 (not including Tether). The prices of the top 10 cryptocurrencies by capitalization fluctuated by more than 70% (High/Low) over the past quarter. The most stable of the ten presented cryptocurrencies was the leader of the cryptocurrency market, Bitcoin, as the range of its price fluctuation equaled 71% (High/Low=9964.5/5826.41=1.71). EOS and TRON experienced especially significant fluctuations. The high and low prices of these cryptocurrencies during the quarter varied by more than 3.5 times, ranging from $22.89 to $5.25 and from $0.101 to $0.029, respectively. Cardano, Bitcoin Cash and IOTA also saw serious price fluctuations (see Table 1.2).
Table 1.2. Price changes in top 10 cryptocurrencies by capitalization during the period from April 1 to July 1, 2018
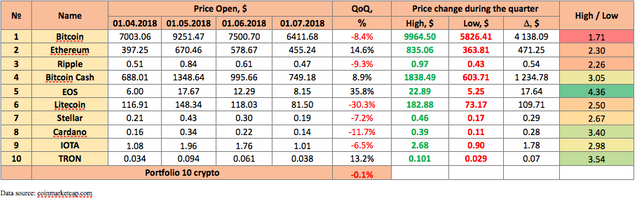
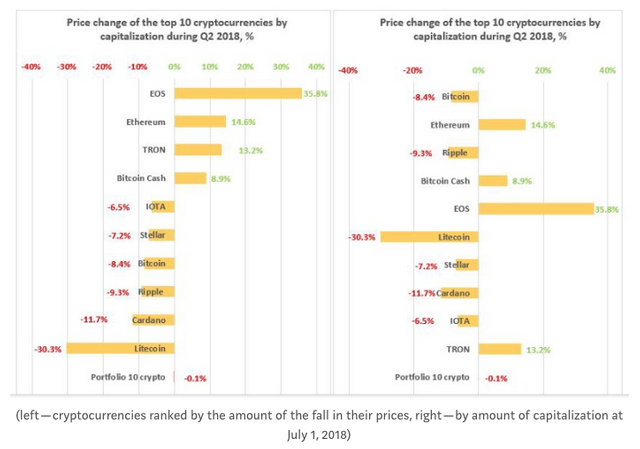
Thus, during the second quarter of 2018 the price change of the leading cryptocurrencies by capitalization ranged from -30.3% (Litecoin) to +35.8% (EOS) compared to the start of the quarter (Fig. 2). The average yield of a portfolio consisting of equal shares of the cryptocurrencies in the top 10 (Portfolio 10 crypto) is practically zero, and equals -0.1%. Overall, cryptocurrency market capitalization fell in the second quarter from $263.9 billion to $257.7 billion, or by 2.4%.
Figure 2. Price change in top 10 cryptocurrencies by capitalization during Q2 2018 (not including Tether), %
After the sustained growth in the cryptocurrency market throughout 2017, most cryptocurrencies and tokens underwent a serious downward adjustment in January and early February. The entire first half of 2018 can be characterized as a period of adjustment and market consolidation. The second quarter of 2018 was more positive for the crypto market, with its overall capitalization falling by a mere 2.4% compared to the end of March.
The month of April was a turning point after the steep decline of the first quarter. Total cryptocurrency market capitalization increased in April from $250 billion to $430 billion, reaching the level of late February. Most cryptocurrencies showed positive price growth, and some of them such as EOS, Tron, Cardano, Stellar and Bitcoin Cash increased by more than 100%. The thaw on the cryptocurrency market can be attributed to several factors, such as the cyclical nature of the market and the favorable news on the global arena. For example, a group of countries including the United Kingdom, France, Germany, Norway, Spain, and the Netherlands signed a declaration on creating a single digital market and partnership in the blockchain industry (https://www.financemagnates.com/cryptocurrency/news/22-european-countries-enter-partnership-boost-blockchain/). Mufti Muhammed Abu Bakar, an advisor on Sharia law for the Indonesian crowdfunding platform Blossom Finance, published a document that, in essence, officially permitted Muslims to use bitcoin (https://www.independent.co.uk/life-style/gadgets-and-tech/news/bitcoin-islamic-law-muslims-cryptocurrency-market-permissible-sharia-news-price-surge-a8302761.html). CBOE announced record trading volume in bitcoin futures (https://www.investopedia.com/news/cboe-broke-record-bitcoin-futures-volume/). The number of transactions on the Chicago Board Options Exchange nearly tripled the statistical average daily norm (6600). However, May was much worse than April, and the price of all cryptocurrencies from the top 10 by capitalization dropped. Total market capitalization fell from $420 billion to $330 billion, or a 21.5% drop since the start of the month. The price of Tron (-35%), Cardano (-34%), EOS (-30%), and Stellar (-30%) showed the largest depreciation. Ironically, these four cryptocurrencies showed the highest growth in April, when the price of Tron increased by 164%, EOS by 260%, Cardano by 132%, and Stellar by 120%. This price performance can be explained by the downward adjustment that is typical of every cryptocurrency after a rapid growth in price. The negative market trend continued in June, and as a result by the end of the second quarter of 2018 market capitalization had fallen to $257 billion, i.e. to the price level at the end of November 2017.
Among the top 10 cryptocurrencies by capitalization, EOS, Tron and Ethereum were the three leaders in terms of price growth. They were able to withstand the negative market trend and grew by 35%, 13% and 14%, respectively. This growth and deviation from market trends can be explained by positive events that took place for each of the three coins during Q2 2018. The key news affecting the EOS price in the second quarter was the news on the upcoming launch of the main network on June 2. The launch of EOS.io will transition EOS from the Ethereum blockchain to its own network, which will lead to a number of improvements. The transition will result in greater speed, lower costs, and increased security and performance (https://oracletimes.com/eos-main-net-launch-on-june-2-the-transition-will-trigger-increased-speed-reduced-costs/). In many ways, this quarter was successful for TRON due to two main positive news items, which led to a sharp increase in price. First of all, the announcement of the launch of a test network of Tron on April 4 (https://twitter.com/Tronfoundation/status/981151379845660672), and the listing of the cryptocurrency on the popular exchange Bittrex (https://twitter.com/justinsuntron/status/988696386819342336). The growth in Ethereum was connected with the issue of the new Casper protocol (https://twitter.com/dannyryan/status/996594517921882112). Another cryptocurrency from the top 10 by capitalization that showed growth was Bitcoin Cash, which grew by only 8%, a fact that could have been caused by the hard fork of Bitcoin Cash.
The other cryptocurrencies showed losses, in line with market trends. Litecoin stands out from this group of cryptocurrencies, as its price decreased by 30% during the second quarter. This fall may be due to a fall in interest and hype around Litecoin, and with the absence of active promotion of this cryptocurrency in the media.
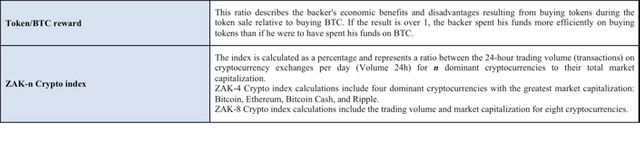
Calculation of the trading activity index on cryptoexchanges
To analyze trading activity on cryptocurrency exchanges, the ZAK-n Crypto index is calculated (see the Glossary). The 24-hour trading volumes (Volume 24h) for the four and eight dominant cryptocurrencies during the second quarter were approximately half of what they were at the start of the year (Table 1.1), which attests to a fall in activity on cryptoexchanges.
The values of the ZAK-4 Crypto indexes are shown in Tables 1.1, 1.3. In April-June the 24-hour trading volumes (Volume 24h) of the four dominant cryptocurrencies (Bitcoin, Ethereum, Bitcoin Cash, Ripple) averaged from $6 to $9 billion (Table 1.3). In April daily trading volumes of $14-19 billion were seen. The daily ZAK-4 Crypto index equals 3-4% of capitalization on average, but during certain periods (April) it exceeded 6%. For example, on April 12-13, 2018, during a significant leap in the cryptocurrency market, the index increased to 6.8%. Against the backdrop of positive news (22 European countries agreed on partnership in the development of blockchain technology, a Sharia law expert recognized bitcoin as “halal”, UAE adopted a plan for strategic development of blockchain technology), capitalization increased over two days by more than $50 billion, from $275 to $327 billion.
This attests to the high liquidity and market dynamism of the dominant cryptocurrencies. On July 1, 2018, the daily trading volumes of the four dominant cryptocurrencies equaled $7.1 billion, i.e. 3.8% of their market capitalization (Table 1.3).
Table 1.3. Daily ZAK-4 Crypto index calculation (from April 1, 2018, to July 1, 2018)
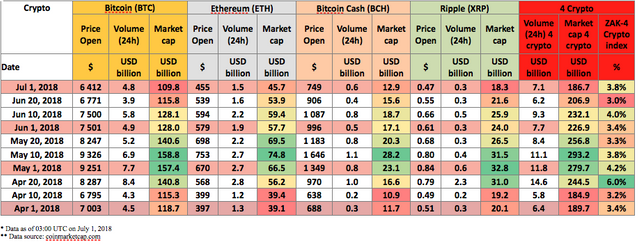
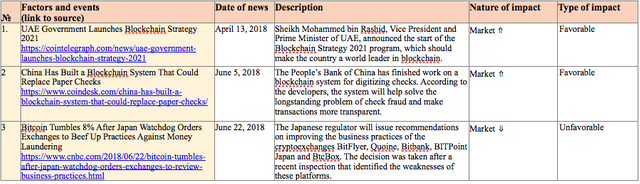
Table 1.4 shows the main events that took place in the second quart of 2018 that had an impact on both the prices of the dominant cryptocurrencies and the market in general, with an indication of their nature and type of impact.
Table 1.4. Key events of the week having an influence on cryptocurrency prices, April-June 2018
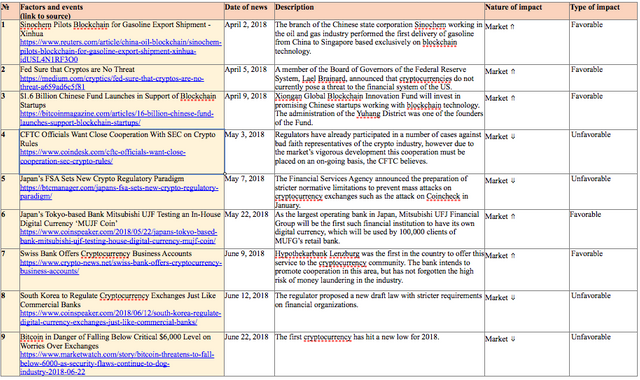
In general, the events of April were positive for the cryptocurrency market, leading to a significant growth from $263.9 billion to $423.2 billion, i.e. by $160 billion. The events in May and June led primarily to a contraction of the cryptocurrency market by $165 billion.
After the implementation of decisions on network scaling (SegWit and Lightning), the cost of bitcoin transactions fell. For example, in December 2017 the transaction fee reached $55, but in early 2018 it equaled $26, by April 1, 2018, it was less than $1, and by July 1, 2018, is equaled $0.687 (see Fig. 3). This reduction was due to a fall in the number of transactions and SegWit integration.
The trend toward a change in the transaction fees for Bitcoin, Ethereum, Bitcoin Cash, and EOS since the start of the year is shown in figure 3.
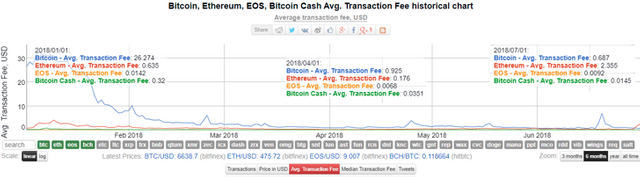
Figure 3. Bitcoin, Ethereum and Litecoin transaction fees
According to information from sifrdata.com (Fig. 3), over the past three months a fairly close correlation has been seen between the indicators of the leaders on the cryptocurrency market - Bitcoin, Ethereum, Ripple, Bitcoin Cash, Litecoin, Stellar, NEM, Dash, and other cryptocurrencies (highlighted red band).
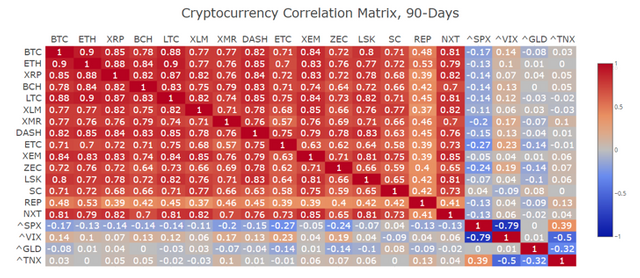
Figure 4. Correlation between cryptocurrencies
It is assumed that the closer the correlation matrix is to 1, the closer the correlation between the price change trends of cryptocurrencies. If the ratio is close to zero, there is no correlation between the indicators. If the ratio is close to -1, the ratio is inverse.
Table 1.5 gives a list of events, information on which appeared last week, which could impact both the prices of specific cryptocurrencies and the market in general.
Table 1.5. Events that could have an influence on cryptocurrency prices in the future
1.2. Market trends
The weekly cryptocurrency and digital asset market trends from December 31, 2017, to July 1, 2018, are presented as graphs (Fig. 1.1-1.5).
Table 1.6. Legends and descriptions of the graphs
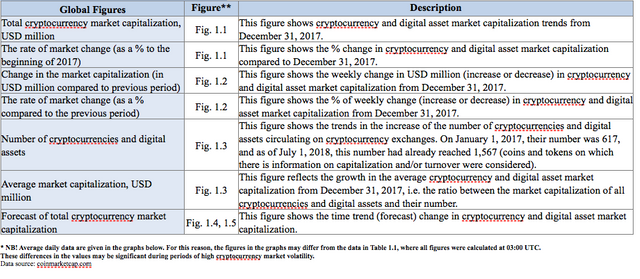
Figure 1.1. Total cryptocurrency market capitalization (weekly trend)
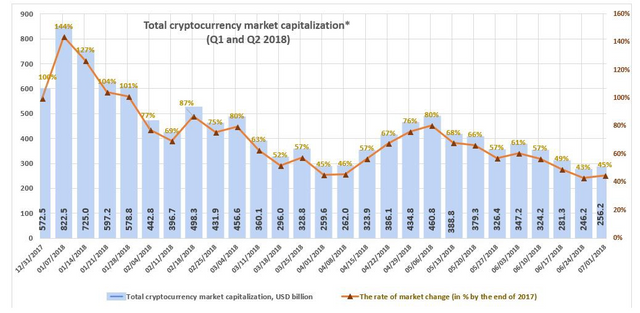
Figure 1.1 shows a graph of the weekly cryptocurrency market change from December 31, 2017, to July 1, 2018. Over this period, market capitalization dropped from $572.5 billion to $256.2 billion, i.e. by 55%. Last week (June 24-July 1, 2018) cryptocurrency market capitalization increased from $246.2 billion to $256.2 billion (as of July 1, 2018, based on the average daily figures from coinmarketcap.com).
Figure 1.2. Change in market capitalization (weekly trend)
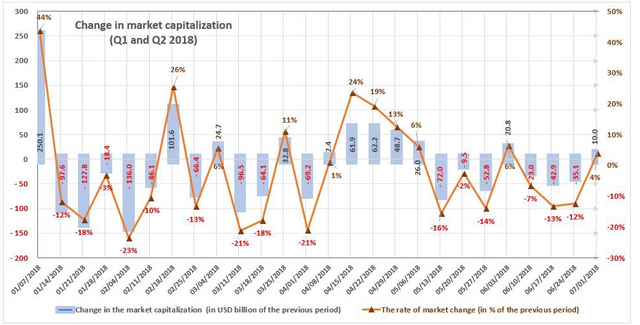
The market is susceptible to sudden and drastic fluctuations. During the first week of January, market capitalization increased by approximately $250 billion, or 44%. The largest weekly fall in the first quarter of 2018 equaled $136 billion, or 23%, during the period from January 28-February 4, 2018.
Nine of the thirteen weeks in the first quarter of 2018 were “in the red”, i.e. capitalization fell based on the results of each of these weeks.
Six of the thirteen weeks in the second quarter were “in the red”. The market grew in the remaining seven weeks. As noted earlier, there was a growth in April, followed mainly by a reduction in capitalization in May and June.
Data source: coinmarketcap.com (coins and tokens on which there is information on capitalization and/or turnover were considered)
Figure 1.3. Number of cryptocurrencies and digital assets (weekly trend)
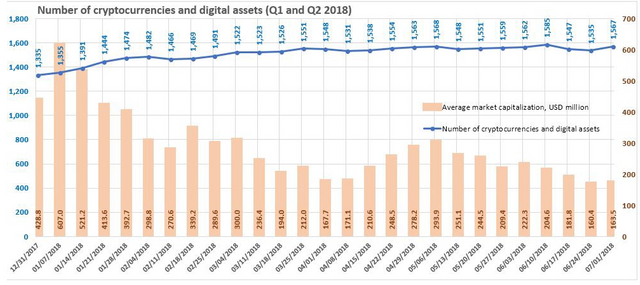

Since December 31, 2017, the total number of cryptocurrencies and digital assets considered when calculating market capitalization has increased from 1,335 to 1,567. Over the past week their number increased by 20, from 1,547 to 1,567, and average capitalization increased to $163.5 million. In total, over the past month 41 new coins and tokens have appeared on coinmarketcap.com. However, it should be noted that a number of other coins and tokens were also excluded from the list. From among the tokens that were added to coinmarketcap.com last week, Metronome, Rate3, Origin Sport and Distributed Credit Chain showed high trading volumes.
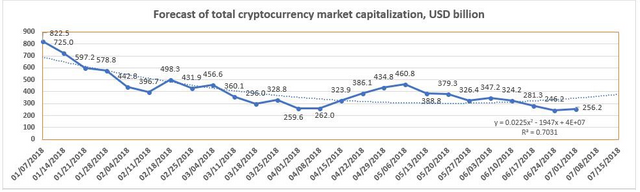
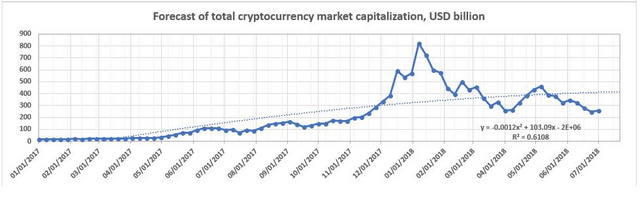
Figures 1.4 and 1.5. Forecast of total cryptocurrency market capitalization
The impact of major institutional players on the cryptocurrency market increased, as did the influence of state regulatory processes. The impact of these factors is not always clear cut. At this stage, it is having more of a negative effect on capitalization.
Hacker attacks also continue to have a negative effect on the cryptocurrency market. Cybersecurity issues also remain a real problem.
At the same time, there are also clearly positive aspects related to blockchain technology. Competition is becoming more serious, and only the best projects survive. The downward adjustment of the cryptocurrency market makes it possible to weed out ineffective projects, and gives startups and more mature companies the opportunity to learn how to use their resources in a more cost effective manner. As organizational costs, costs related to mining, and transaction fees fall, the demand for the qualitative and quantitative characteristics of blockchain grow.
The forecasts predicting an appreciation in the bitcoin price to $40,000 and more by the end of 2018 look less likely now.
However, it is the crisis and collapse of the cryptocurrency market in the first half of 2018 that could facilitate the increased effectiveness of the technology and a reduction in costs related to the circulation of cryptocurrencies. This will give a new impetus to headlong growth, as all economic process are cyclical.
CNBC channel on its Twitter CNBC's Fast Money has presented an interview with the CEO of the Bitmex exchange, Arthur Hayes. In his opinion, bitcoin "found the bottom" and the CEO believes that by the end of the year the rate of crypto currency can rise to $ 50,000.
As reported by NewsBTC, according to a group of investigators the price of the first cryptocurrency could range as high as $25,000-$44,000 with the appearance of exchange-traded funds (ETF) focused on bitcoin. Exchange-traded investment funds (ETF) could quickly ensure a new influx of capital into this market segment. In particular, we note the opinion of Eric Balchunas, an ETF analyst from Bloomberg, who said “While I’m still skeptical a Bitcoin ETF gets approved in any form this year, you gotta be in it to win it, and this extra hustle from VanEck could pay off down the road.” VanEck oversees more than $45 billion in assets and manages more than 70 exchange-traded products.
Quarterly ICO Market Analysis (Q2 2018)
1. General analysis of the ICO market (during the second quarter)
1.1. Brief overview of ICO market trends
1. General analysis of the ICO market (during the second quarter)
1.1. Brief overview of ICO market trends
The second quarter of 2018 was successful for ICOs. The total amount of funds collected exceeded $4.3 billion, and that is without counting the large EOS ICO that concluded on June 1, which was the unquestioned leader in funds collected. The Block.one project issued 900,000,000 EOS tokens. This blockchain project ultimately collected $4 billion, or 7.12 million ETH (The fundraising brought in 7.12 million in total ether as of Wednesday night, according to Token Report, a division of blockchain advisory firm New Alchemy). The distinguishing feature of this project is the lengthy period of performance of the ICO. The issue of tokens was performed over the course of a year, from June 26, 2017, to June 1, 2018. During its first five days the ICO sold 200,000,000 EOS tokens, with another 2,000,000 tokens subsequently being sold every 23 hours.
This project, which, like the two previous large projects TON and Petro, which were held in the first quarter of 2018, once again confirms the well-known Pareto Principle: 20% of efforts give 80% of results, and the other 80% of efforts give only 20% of results. The applicability of the principle to the performance of ICOs was considered in the article “ICO Success and Performance. The Pareto Principle [80/20 Rule].” The analysis discovered that the largest 345 ICOs accounted for $17.85 billion, or 90%, of all funds collected.
More than 600 ICOs were completed during the second quarter. The resource https://www.icodata.io/ICO/ended alone shows 375 completed projects during April-June 2018. Another resource, https://icobench.com, shows more than 450 projects that are already scheduled to start after July 1, 2018.
There have been a variety of projects over the past quarter, for example:
- The project to create the stable cryptocurrency Basis collected $133 million.
- The US Securities and Exchange Commission (SEC) launched a fake ICO, to teach investors to recognize the typical warning signs of fraudulent campaigns.
- During its ICO, the TaTaTu project, which plans to issue films on blockchain and is basically an entertainment video platform, managed to collect the surprisingly large amount of $575 million (June 20, 2018).
- The public token sale of the DCC project (a decentralized ecosystem for providers of financial services around the world. Solves the problem of providing loans using blockchain) ended in 20 minutes.
- The QuarkChain project. Demand for project tokens during the ICO exceeded supply by several times. The ICO’s Hard Cap was set at only $20 million. In the end, after the completion of the ICO the token price grew by 10x to 18x (the ICO was completed on June 3, 2018).
- Metronome’s token sale was set up like an auction with a falling price (June 18-25, 2018). The developers plan to develop a cryptocurrency capable of being exported and imported between various blockchains.
- and many others.
A important event in the financing of blockchain technology that took place in China must be noted. The total financing of Qulian Technology (Fun Chain Technology) from the Shanghai-based finance company Xinhu Zhongbao will exceed 1.5 billion yuan (around $226 million). After the financing is completed, Fun Chain Technology will become the first “quasi-unicorn” enterprise in the blockchain industry. Fun Chain Technology is the leading international blockchain team behind the Hyperchain project.
The popularity of ICOs is growing despite the announcements of several publications that there are many fraudulent projects. The Wall Street Journal published research according to which nearly 19% of all ICOs are questionable. In addition, in the opinion of Valerie Szczepanik, an official of the US Securities and Exchange Commission, a number of ICOs issuing new cryptocurrencies are in fact concealed offers of securities, and this could pose a threat to investors.
Table 1.1. Brief ICO market overview, key events and news for Q2 2018
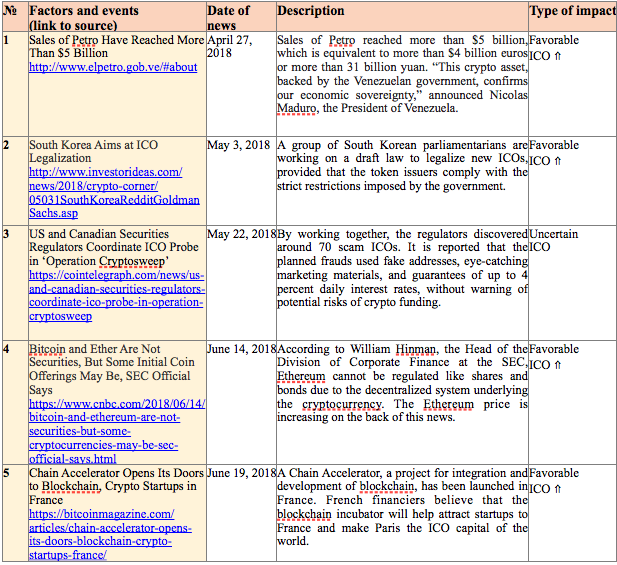
Table 1.2 shows the development trends on the ICO market since 2017. Only popular and/or successfully completed ICOs (i.e. ICOs which managed to collect the minimum declared amount of funds) and/or ICOs listed on exchanges were considered.
Table 1.2. Aggregated trends and performance indicators of past (completed) ICOs1,2,3,4
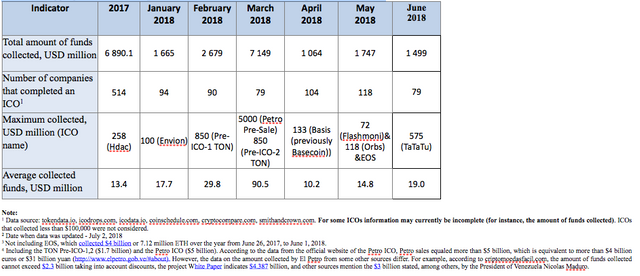
The data for the previous period were adjusted to account for the appearance of more complete information on past ICOs. The amount of funds collected via ICOs during the past month (June) equaled $1.5 billion (not including EOS). This amount consists of the results of 79 successfully completed ICOs, with the largest amount of funds collected equaling $575 million (TaTaTu ICO). The average amount of funds collected per project equaled $19 million (see Tables 1.2, 1.3). Overall, more than 150 ICOs were completed last month, but information on the amount of funds collected is not available for all of them.
Table 1.3. Amount of funds collected and number of ICOs
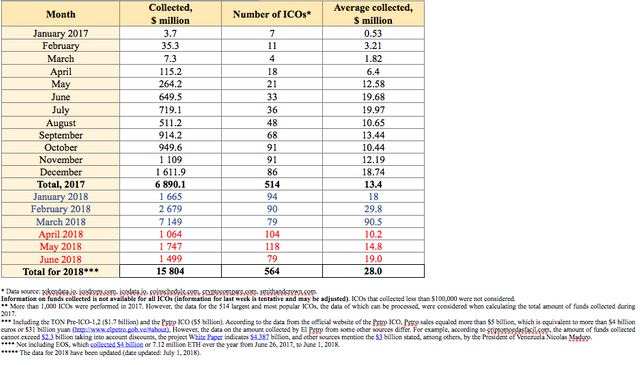
Table 1.3 shows that the largest amount of funds was collected via ICOs in March 2018, mainly due to the appearance of major ICOs. The highest average collected funds per ICO was also seen in March 2018.
In total, more than $15.8 billion were collected via ICOs in the first half of 2018 (and that is without the funds of EOS, an ICO that lasted for an entire year). This amount was collected by a total of only 564 projects.
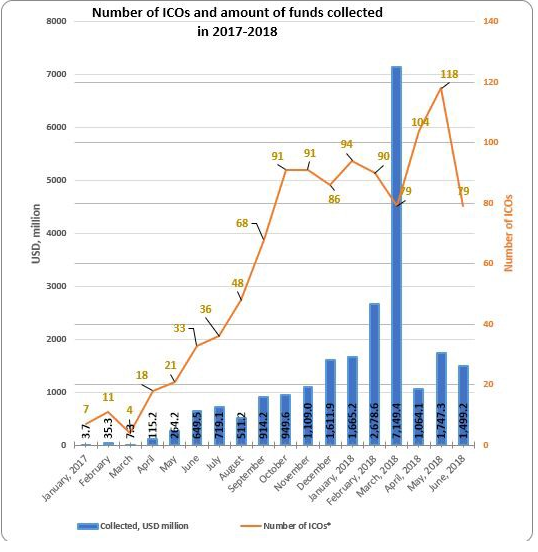
Figure 1.1. Trends in funds collected and number of ICOs since the start of 2017
1.2 Top ICOs during Q2 2018
Table 1.4. Top 20 ICOs by the amount of funds collected during Q2 2018
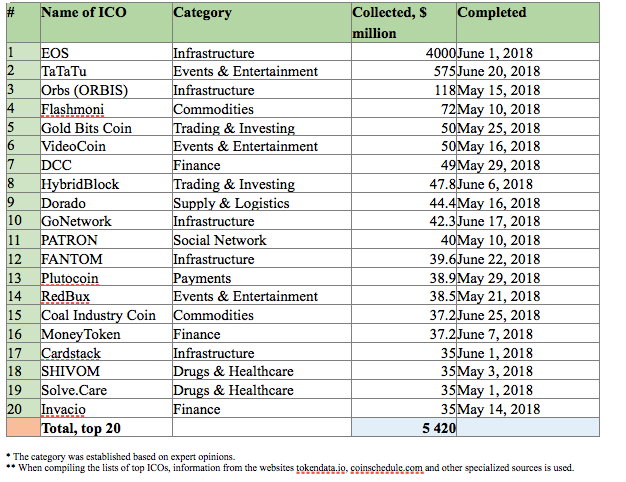
Table 1.4 shows the top 20 largest ICOs by funds collected, most of which belong to the categories Infrastructure, Events & Entertainment, Finance, and Commodities.
Figure 1.2. Top 20 ICOs by the amount of funds collected during Q2 2018
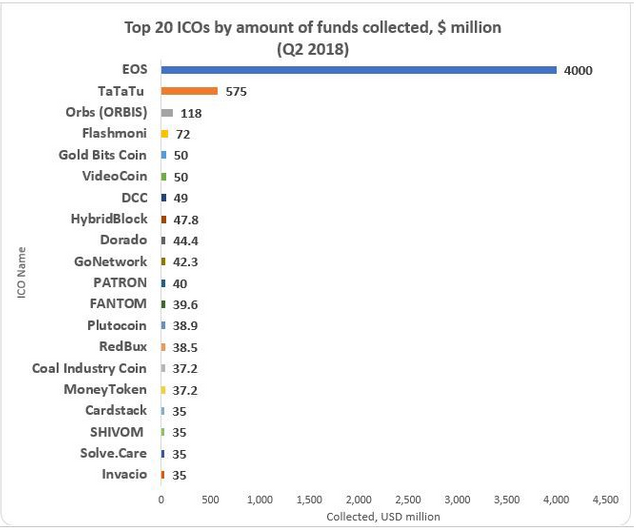
During the second quarter of 2018 more than $4.3 billion were collected (not including the largest ICO, EOS, which was completed on June 1). However, due to the overall fall in capitalization of the cryptocurrency market, a gradual adjustment in ICOs is being seen. This delayed reaction is leading to a steady fall in the hard cap requirements of projects, with the effectiveness of fund collection also beginning to drop. To be sure, the effectiveness of ICOs depends on many factors, including a growth in cryptocurrency market capitalization.
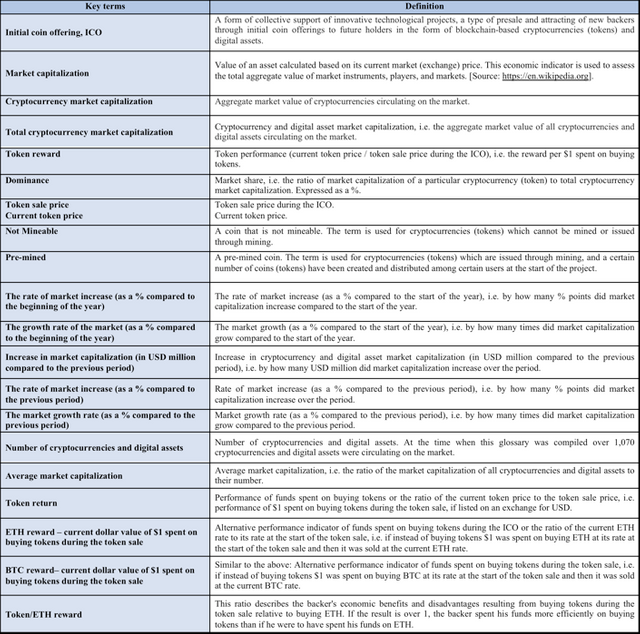
The Glossary is given in the Annex.
Annex
Glossary
Hello forinnov!
Congratulations! This post has been randomly Resteemed! For a chance to get more of your content resteemed join the Steem Engine Team