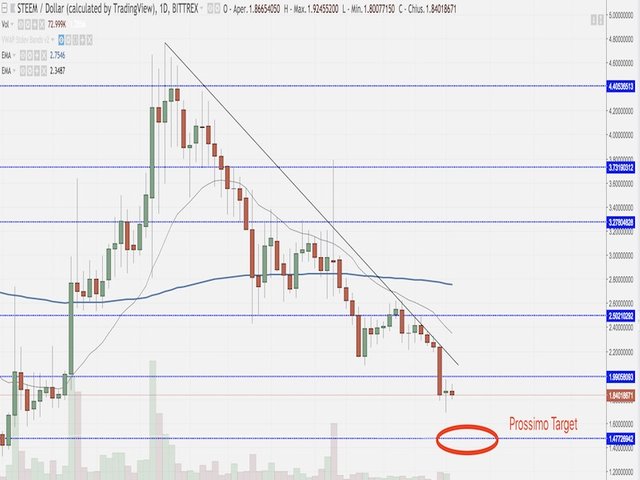
Steem: graph analysis 12/06/18
The price of Steem on 11 June opened in area 1.85 dollars testing the highs in area 1.96 and then start its race to the bottom and bring the price to 1.69 and close to 1.86 dollars. The resistances to keep under observation are: 2 and 2.50 dollars (monthly resistances), while for the supports: 1.47 and subsequently 0.80 cents of dollars (monthly supports). The moving averages at 100 and 200 periods are currently flat and are respectively in area 2.77 and 2.45 dollars.
For those wishing to buy Steem
Enter when the price breaks resistance in the 2.50 dollar area, with a stop loss at 2 and take profit in the area 3.27 dollars.
For those who currently own Steem
Continue to liquidate the position if the price were to remain below 2 $.
For those wishing to sell Steem
If you are not already involved, possible bearish inputs when the price breaks zone 1.68 dollars, with stop loss positioned at 2.2 and first target in area 1.47 and later in the area 0.87 dollars cents.
Target
Bearish
2: reached 10 June 2018
1.50: not reached
Bullish
2.50: reached April 12, 2018
3.30: reached April 19, 2018
3.73: reached April 25, 2018
5.53: not achieved
Congratulations @fedeparma74! You have received a personal award!
Click on the badge to view your Board of Honor.
Do not miss the last post from @steemitboard:
SteemitBoard and the Veterans on Steemit - The First Community Badge.