Single 100+ BTC Buy Contract Seen Today ||| How To Learn About Trading ||| TradingView.com

After Bitcoin gained so much value in the last weeks with super high volatility, this coin seems to stabilise a bit. Altcoins were suffering, I suppose because many of the Altcoin users decided to sell them for Bitcoin. Especially against the Bitcoin, Altcoins dropped a LOT in value, but even against the US Dollar the Altcoins were not doing good at all.
Altcoins on the Rise
Today the cryptomarket broke the 500 Billion US Dollar marketcap (at least I think it was broken for the first time today), and we've seen the dominance of Bitcoin decreasing over the last days from somewhere in the 60% to around 56% at the time of writing this post.
Since last two days, the world is turning, so it seems. Alts getting a lot more attention and many of the coins are on the rise.
Newbie Trader
I'm a small amateur trader - still pretty much newbie - and try to trade a bit on breakouts. For the last months I didn't really look into it, but started again more actively following the market since a couple of weeks ago. Fortunately I could sell some Steem and SBD at BTC value spikes; That got me wanting to really learn trading based on predicting the market, ie using technical analyses.
Last weekend, I discovered this trade analyses tool, Tradingview. This tool has a free to use components which already gives a lot of value and tools for technical analyses. For now, I'm not trying to make analyses myself; But I started to check out all the trade idea posted by others. Mostly I concentrated on the big coins, like Litecoin, Ethereum, Monero and based on what I was reading and comparing, I bought myself some Litecoin (already had some, but added to my portfolio some more) as well as some Ethereum (again, added some more to what I already had). For both coins it was predicted by many PRO users on Tradingview these were at the point of massive breakout and would go parabolic.
And you know what happened? Litecoin and Ethereum went parabolic within half a day and two days from the moment I added some small sub-units of these coins to my portfolio; And they are still on the rise!

image: screen shot - hour or so ago - Litecoin/Bitcoin with two crossing lines I set myself to define breakout point. And as you can see in the chart, the coin broke out at little after noon today. Note: at such breakout point, the coin value can actually do three things: go UP, go DOWN, go further sideways, so nothing is for sure :)
For the last two days I'm following on Poloniex the trade contracts, especially at times when volumes are high, when the coins are at some resistant level. I wanted to learn more about for instance big sell walls of 100 to 500 Bitcoin and how they are taken away.
What I noticed is that when the buy volumes start to increase to levels that it looks like a new (breakout) wave is starting, some of the sell orders are taken away, sometimes removing 100+ BTC from the sell order sheets.
But, when the value of a coin is right at the point of such sell wall, and the sellers are not removing their outstanding orders, I also saw large single buy orders/contracts coming in; Buying the wall; With 5 to sometimes 15 and 20 Bitcoin value per buy contract. That are massive values coming in!
Single Buy Contract of 100+ Bitcoin
Just an hour ago with Ethereum, I was amazed to see a sell wall of 102 Bitcoin being taken down by a single buy contract of the same value. 102 Bitcoin which is equivalent to around 1,8M US Dollars; 1.800.000 Million US Dollars; One Million and Eight Hundred Thousand US Dollar. I simply could not believe my eyes!
WOW !!!
The removal of this sell wall, gave way to the current wave upwards Ethereum is going through right at the time of writing.
TradingView
When you are in trading or want to go into trading, and you feel a bit lost in how to trade, I can advice you the tool Tradingview. Look at some coins, check out all the ideas and advices given by others, concentrate on those users that are identified by PRO (they are a paying customer to the tool and it doesn't come cheap, so I respect their ideas more then the none PROs). Interact with those who give trade ideas; I've seen quite an active community and willingness to respond to questions. This tool is a great help to me, and to be honest, it gave me quite a bit increase of my cryptocoin trading portfolio :)
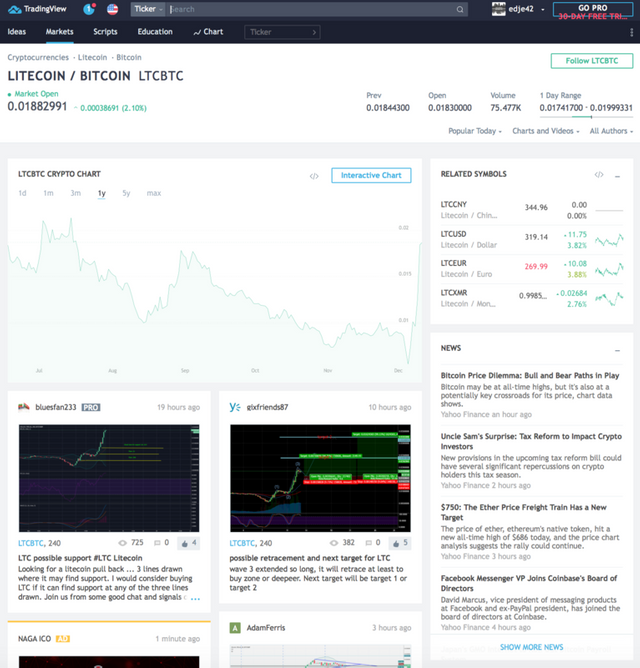
image: screenshot I took from the main page of Tradingview with Litecoin/Bitcoin charts. Below the chart many trade ideas from the users of Tradingview; These you can click to open the trade idea, see the charts better and read the entire post. The one on the left (bluesfan233) is a PRO user, the one on the right (gixfriends87) is a normal user.
Disclaimer: Nothing of what I wrote here is an advice to buy any of the coins, not Litecoin, not Ethereum, none of the other Altcoins. Use the information I provided you to learn about trading.
Good info,
Im now tryin to learn "candlesticks" For example. after or before a trend you see a hammer form candlestick. or a hanging hammer. Or other ones that indicates that the trend is ended.
Dont know much yet, but so far easier then I thought. Sooner or later i can read a chart like a book. :)
Good day there
Yeh, the theory is not too complicated. You will also notice a lot of waves, on large scale (hours to days per candle stick) and on small scale (minute candles). Coins may start doing something when the waves are getting small in amplitude. BUT: as I mentioned as well, in the end the coin can do three things at a clearly marked breakout point: move UP, move DOWN, or go sideways. I've seen all these happen. At UP prediction at breakout point, I've seen DOWN big time, as well as sideways and then DOWN big time. So, in the end technical analyses helps to define when to go into a coin and when to go out (resistant lines and so on), but also soft things are playing a role, ie news. Also BTC volatility plays a massive role in what eg Alts are doing, regardless of what the charts tell you, last weeks Alts went down the gutter, because of BTC going up and up.