CRYPTONITE-ELITE EOS CHARTS 3/21/2019
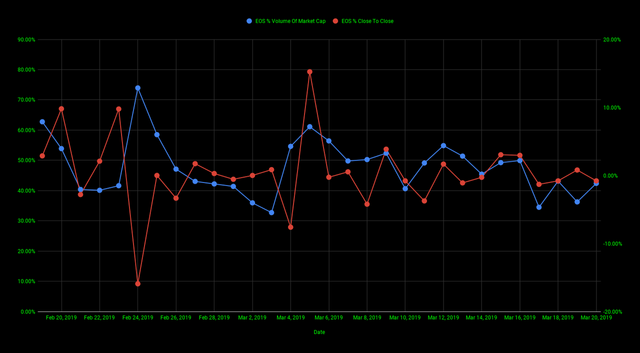
The chart below gives us a look at EOS's % volume of market cap (blue line) and EOS's % increase/decrease close to close (red line) for the past 30 days.
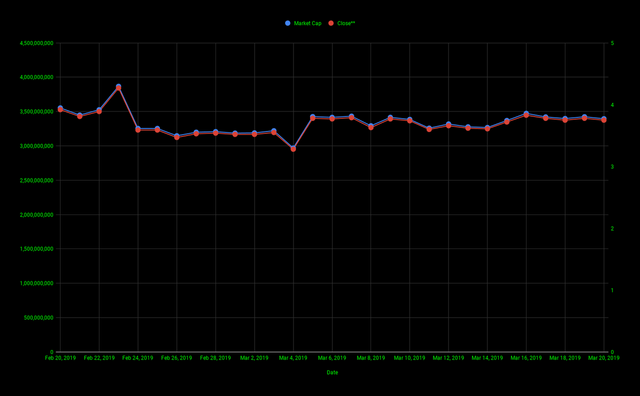
The chart below gives us a look at EOS's marketcap (blue line) and EOS's closing price (red line) for the past 30 days.
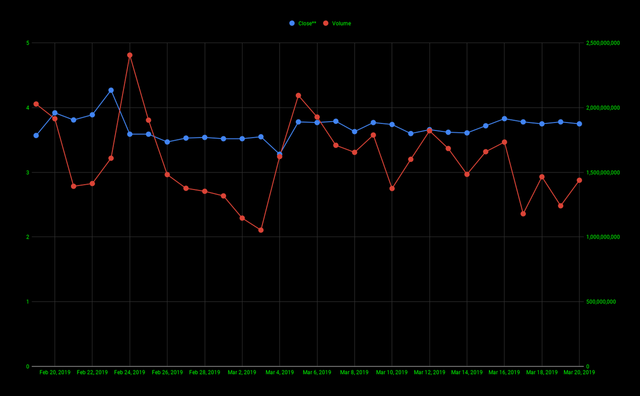
The chart below gives us a look at EOS's closing price (blue line) and EOS's volume (red line) for the past 30 days.
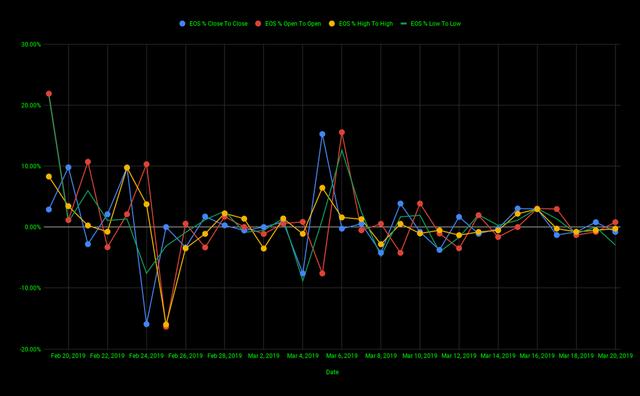
The chart below gives us a look at EOS's % increase/decrease open to open (red line), % increase/decrease high to high (yellow line), % increase/decrease low to low (green line), and % increase/decrease close to close (blue line) for the past 30 days.
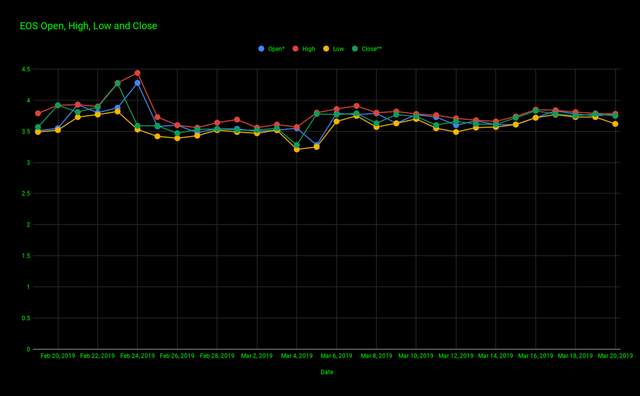
The chart below gives us a look at EOS's open (blue line), high (red line), low (yellow line), and close (green line) for the past 30 days.
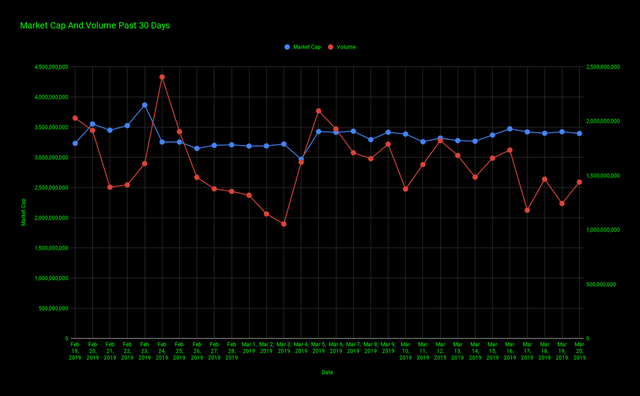
The chart below gives us a look at EOS's marketcap (blue line) and EOS's volume(red line) for the past 30 days.
Congratulations @cryptonite-elite! You have completed the following achievement on the Steem blockchain and have been rewarded with new badge(s) :
You can view your badges on your Steem Board and compare to others on the Steem Ranking
If you no longer want to receive notifications, reply to this comment with the word
STOPDo not miss the last post from @steemitboard:
Vote for @Steemitboard as a witness to get one more award and increased upvotes!