How to Predict the Trend in Cryptocurrency Part 6 Using RSI
First of all I really apologies to my all followers who have to wait for my next post. The reason for delay in posting new article is, I was too much busy in some projects. Now come to the point, in previous posts we discuss price action and Bollinger band. Now we will discuss RSI ( Relative Strength Index ).
It is generally considered in stock markets, Forex trading and in cryptocurrency. For example when Bitcoin approaches to 30 value of Relative Strength Index then people should buy Bitcoin. People should hold the Bitcoin until value of Relative Strength Index reaches 70.
But according to my research it happens only in the sidewave trend. So when Sidewave trend occurs, lot of people who are using RSI they take advantage of above mentioned RSI strategy. But as soon Bitcoin or any other cryptocurrency shifts from sidewave trend to Buying or Selling Trend, all traders who were trading RSI with 30 and 70 value strategy bear losses straight away.
What is RSI Indicator.
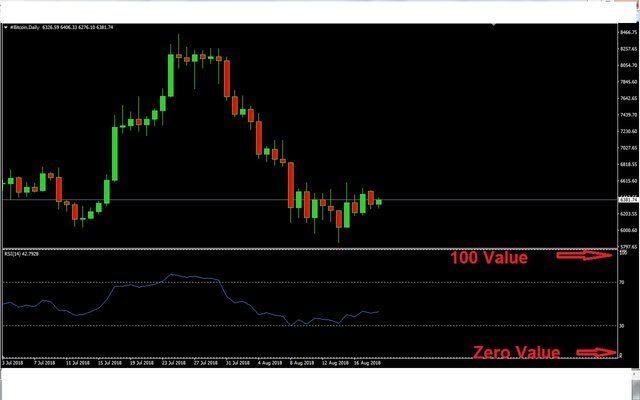
RSI is calculated on the basis of last 14 days average. Its value ranges from 0 to 100.
Now question is how to use RSI for making profit consistently. Read the remaining article carefully and make profit consistently using following information.
RSI Behaviour in Sidewave Trend
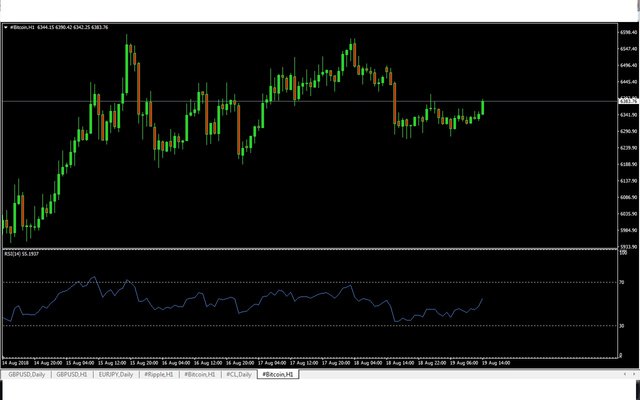
In the below chart of Bitcoin RSI value is between 30 to 70. So the price of Bitcoin is ranging between this value. So You can buy at 30 and can sell at 70.
RSI Behaviour in Selling Trend
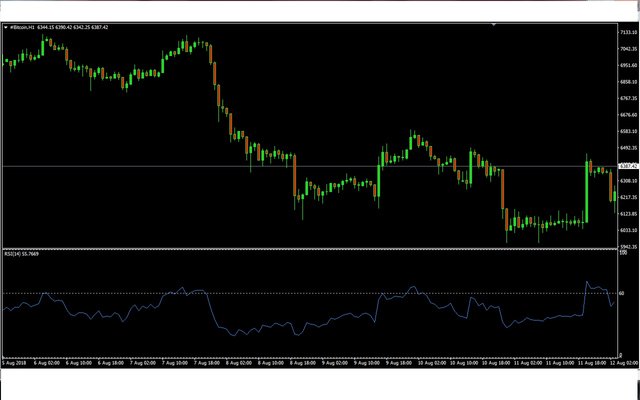
It is really very important point. More than 90 percent people buy cryptocurrency blindly. They do not know what is current trend. This tip which is I am giving to you, it can change your financial life. Never buy cryptocurrency in selling trend. How to predict the selling trend. Look at the chart below of Bitcoin. In the whole chart RSI value remains under 60 which is showing great sign of selling trend. You can easily pick the selling trend.
RSI Behaviour in Buying Trend
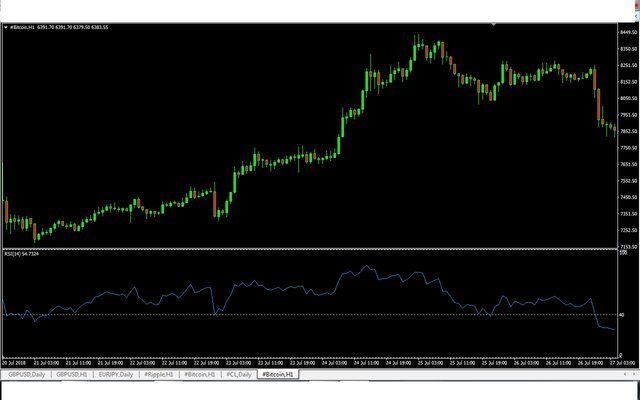
How to predict Buying Trend. In the below chart it is not difficult to predict the buy trend. As far as RSI value cross 60 and then remains above 40 it is in buy trend. So in the below chart it is clear that price remains in buy trend from 22 July 2018 to 26 July 2018. But on 27 July it moves down and even it crosses below 40 RSI. This shows that no more buying trend. So one can easily sell the Bitcoin which was on holding position since 22 July 2018.
So trend determination thorugh RSI indicator is very easy and predictive. It took me more than two years research to find out the above mentioned behviour of price.
So if any of my follower have any question about this article, feel free to ask me through comments section. If any point which I could not elaborate or you could not understand , you can ask me.


Hello,
Great tutos!!
The 6 parts are very well explained.
Thank you very much. Very useful fo me. :)
Subscribed.
Best regards,
@SolarPhasing
If you have interest in cryptocurrency then combine information from all parts and then apply to market for Buying any cryptocurrency and closing the trade. This will really help you lot for making good and consistent profit.
Congratulations @cryptoexpert79! You have completed the following achievement on Steemit and have been rewarded with new badge(s) :
Click on the badge to view your Board of Honor.
If you no longer want to receive notifications, reply to this comment with the word
STOPDo not miss the last post from @steemitboard:
SteemitBoard and the Veterans on Steemit - The First Community Badge.