Double bottom?
Despite everything I've already said over the last few days about BTC heading towards a 2018 ATH of $3000 - $3200, I have to acknowledge another possibility.
Like many investors I've been watching the performance of suddenly volatile BTC rather closely these last few weeks.
It looked like it yesterday, though I wasn't sure, but I'm now looking at a very clear double bottom on the BTC chart.
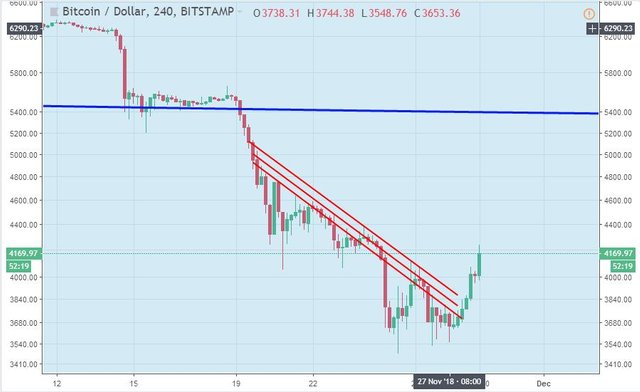
Made by Bit Brain with TradingView
A double bottom?
For those who don't know: a double bottom indicates a reversal. It's a fairly strong indicator, depending on its characteristics. On the charts it appears as a "W" shape, characteristic of something which has found strong support.
The parallel lines on the chart above are lines I drew in before the double bottom started forming, they were tracking the drop of BTC price. I was doubting that it would happen, but I knew that if the price suddenly jumped above the uppermost of those three lines - as it now has - then I would have to reassess the situation.
To confirm a double bottom, analysts look for a volume increase in the two places where the price climbs. Such an increase confirms bullish buying power. The first leg of this W certainly has a nice clear volume spike, while the second leg has a less steep, yet sustained volume increase. It's not a great confirmation, but it is there.
The other thing that's important when looking a a double bottom is the time frame. As I said in the post Analysis of long-term BTC patterns two days ago:
"... I default to the longer-term data. With TA you always find that long-term is more reliable and more predictable."
This is certainly the case with double bottoms. The longer the term that the pattern occurs over, the stronger the indication of a reversal. I would label this a short-term double bottom.
Beyond the double bottom
A double bottom indicates some form of strong support. The Fib levels do indicate support (https://steemit.com/cryptocurrency/@bitbrain/analysis-of-long-term-btc-patterns), but I have been of the opinion that it wasn't going to hold.
Looking at Longs and Shorts we see that Longs are falling during the latest BTC rise (which is bearish) and that Shorts are still generally climbing (which is also bearish).
What do I think?
As much as I would love this to be a turnaround of the dropping BTC price and the start of the long awaited bullish climb, I am definitely not saying that at this stage. Instead I consider it far more likely that this is a Dead Cat Bounce or a Bull Trap (as I discussed here only yesterday: https://steemit.com/cryptocurrency/@bitbrain/caution-bull-traps).
Conclusion
Be very careful, I would wait for positive confirmation before executing any trades. DYOR.
Yours in crypto,
Bit Brain

Bit Brain recommends:
Crypto Exchanges:


Published on

by Bit Brain

Sitting back and waiting for confirmation as well... getting some fiat ready just in case as I have been creating my Holiday shopping list!
Posted using Partiko iOS
Can you share what's on your list?
I am looking at the large ones... ETH looks interesting given the potential move towards POS for only 32 ETH which could make it an interesting play at these prices. I also like Litecoin as I think they will benefit from the recent BCH fork.
Posted using Partiko iOS
Interesting. What about BTC itself, do you think altcoins are a better investment than BTC with a bull market on the horizon?
I feel that I have enough allocated to bitcoin at the moment so would prefer to diversify. However, if it becomes too attractive I will also buy some.
Posted using Partiko iOS