BTC - 05 September - Don't Panic!
Nothing fancy here, just what I'm seeing today
Any Douglas Adams fans here? If not then the whole "Don't Panic / Towel" joke will be wasted, so I hope that there are at least one or two among you.
I just want to show today what I'm seeing on the charts, with a little input from my side to guide you.
By Barbara Abate (Flickr) [CC BY-SA 2.0 (https://creativecommons.org/licenses/by-sa/2.0)], via Wikimedia Commons
BTC - 05 September - Don't Panic!
All text in this post refers to the chart directly above it:
Made by Bit Brain with TradingView
BTC dropped relatively significantly today, but appears to have been caught by the support level from which it most recently started climbing on 30 August. I expect it to stabilise here and the recommence climbing within a 24 hour period.
Made by Bit Brain with TradingView
In case the blue and green lines are confusing: these screenshots are taken from a working chart that I use and constantly update. The green lines were drawn back on 30 August when I was looking at the two most probable price movements. The blue lines are part of a much larger converging triangle.
The letters and numbers on the Elliott Wave lines are not of any significance and are not to be taken as an Elliott Wave analysis. They come from this post.
Made by Bit Brain with TradingView
For now I think BTC will continue to follow a path similar to the positive green arrow I have drawn. I expect that trajectory to continue until it hits the blue line of the triangle which is a resistance level. It might break through resistance, I'm in two minds about that, but I consider it more likely that BTC will only break out of the large tapering triangle a month or two later, after it has dipped back to around $6000 again.
Made by Bit Brain with TradingView
For the short term future I expect BTC to remain in this channel until reaching the blue resistance line.
Made by Bit Brain with TradingView
I am not really perturbed by the price drop today, I think it is within the normal realms of price fluctuations, perhaps a reaction to news of the Goldman Sachs trading desk becoming a lower priority or something to do with standardising EU ICO regulations. Who knows, FUD seldom plays by the rules of logic.
I'm experimenting wiht my long-term tool, the K=50 setting Stoch indicator on shorter term charts. According to it we still have some climbing to do in this wave. It looks like it will probably reach "overbought" around the same time that the BTC price reaches the blue resistance line. I am increasingly placing trust in this indicator at this specific setting.
From https://coinmarketcap.com/currencies/bitcoin/
Also of great significance is that volume is becoming increasingly stable and is rising slowly. I will take a slow rise over a fast one any day! I always knew trouble was coming late last year when prices kept rising so fast! This is the BTC chart, note the volume stabilising and smoothing out in the second half, and then rising slowly. I'm using CMC charts because they are simple and easy to see major changes on.
From https://coinmarketcap.com/charts/
The Total Market Cap volume looks even better, smooth and stable and rising nicely. Volume has shot up today. Together these signs are very bullish: slow stable growth is just what a bull market needs to build on and steady volume increase almost certainly means imminent price increase. It also shows strong support when prices drop, i.e. the market expects prices to continue to rise.
Trade accordingly and DYOR!
Yours in crypto,
Bit Brain
Bit Brain recommends:
Crypto Exchanges:
Published on
by Bit Brain
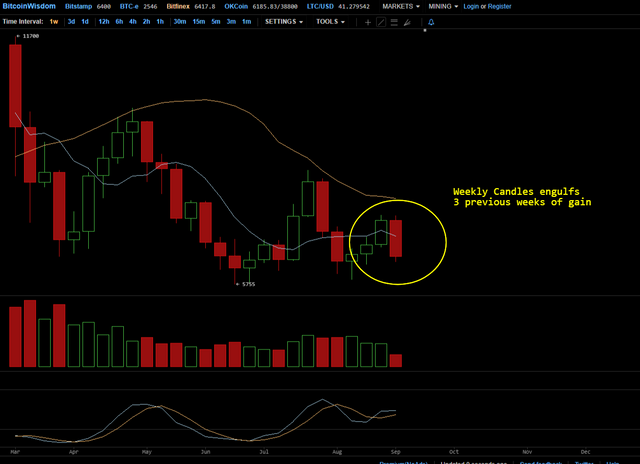
Not to burst your bubble @bitbrain but go look at the bullish three line strike pattern on the Bulkowski pattern chart (65% chance of bearish reversal):
http://thepatternsite.com/ThreeLineStrikeBull.html
Now look at this candle:
Plus we've got a descending bearish triangle on the weekly which still according to Bulkowski foreshadows a breakdown %64 of the time... I mean I am no fortune teller but most signs point to a very bearish scenario right now.
Agreed...technically, this market is screaming for lower prices. We may see a quick retest of $6,800-$7,000, but right now, all signs point to lower prices in the short term. That said, longs are down and shorts are approaching all time highs on Bitfinex. The only thing that MIGHT send price up is a short squeeze...and man would that be ugly for retail. In fact, the only thing preventing me from shorting bitcoin is it’s too obvious a play.
Yeah, I got that one wrong!
It will be a better market without having to worry about Goldman Sachs trading in it anyway. They can stay out for all I care! Not sure why the market sees this as bad news; its not like they were going to hold on to any as it is a trading desk.
Well put!