BTC long-term pattern repetition
Yesterday I spoke about doing: "another BTC pattern-based, long-term price analysis post". This is it.
This is not a post with lots of lines and levels and specific predictions; it's one of those posts where I point things out to you and then expect you to draw your own conclusions.
I have mentioned before that I find value in identifying patterns in crypto (and other) charts. Bit Brain's Fourth Law of Crypto: "Technical Analysis is a graphical representation of market psychology. It is a way to visualise the feelings of masses of people wrt trading." According to my law, chart behaviour is not random. It is a function of human behaviour, which is far from random, and can be very predictable!
I really wanted to do an overlay for this post, which was my intention. Sadly it just doesn't work: I can't get nice line charts that follow the candles accurately at this scale. To do picture editing with different colour candles is far more tricky than with a nice solid line. So in the interests of saving time doing image editing, I'm just going to show you the two pictures to compare and let you visualise the rest.

Made by Bit Brain with TradingView
BTC long-term pattern repetition
I'm going to cut straight to the chase. The picture above shows three similar periods in Bitcoin's history. These are periods of high growth, followed by a series of bear market waves, before they terminate at the start of the bull phase.
I wanted to show you this picture to make one important fact visible to you, and to correct an common misconception:
Note the sizes of the different rectangles, each one representing a period such as that mentioned above. Contrary to what I often see suggested in crypto posts and crypto discussion groups, the duration and amplitude of such periods do not have to be equal!
Granted the current cycle is not complete yet (so we can only estimate it) but the previous two clearly demonstrate the fact that such events can run over very different time periods!

The bear market that dominated most of 2014 and 2015 is the best precedent that we have to which we can compare our 2018 bear market and recovery. The pattern we are going through now strongly resembles that of the 2014/15 market. That is what I want to point out to you today.
I am doing this slowly and deliberately, major point by major point, because TA is a game of interpretation of the facts. I am strongly of the opinion that every other analyst I have seen attempt this comparison so far has got it wrong. Let it never be said that Bit Brain is afraid to swim against the flow!
Whenever I see other analysts do this, I see them compress the 2018 market to make it look more 2014/15ish.
That is the wrong thing to do!
Look at the above chart again. The 2018 market event is smaller than the 2014/15 one! To match the two markets up, one needs to stretch out the 2018 market! You need to make 2018 bigger, not smaller!

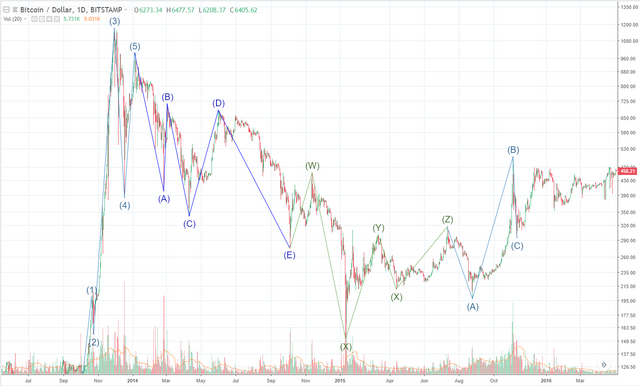
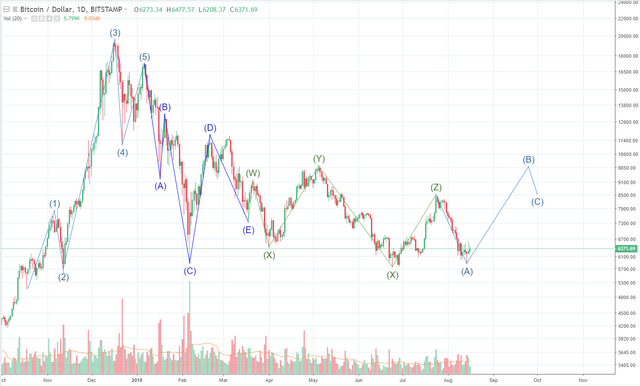
What I have done today is to stretch 2018 out for you, to the same size as 2014/15. What I did after that was to assign letters and numbers to the peaks and troughs of each major wave of the two markets. I just used Elliott Wave tools so the numbers 0,1,2,3, and letters A,B,C, etc don't mean anything specific, but the names of the points on the two charts DO correspond with their counterparts on the other chart.
Let's take a look at whether they resemble each other at all:
Here is 2014/15. Compare its points to those of 2018 located directly below it:


Both charts made by Bit Brain with TradingView
No, they are not templates for one another, but there is very strong correlation between the points on the two charts. More importantly, the 2018 chart was stretched to achieve the correlation, not compressed. What does this imply?
It means that the 2014/15 chart can be used to predict the possible future path of the 2018 chart. I took the liberty of adding points (B) and (C) in on the right hand side of the 2018 chart. Those point are by no means meant to predict any time periods or price levels, they are just a rough approximation of potential future BTC price movement based on the 2014/15 market and a thumb-suck estimate.
The next major implication is that we are standing on the cusp of the next bull market, or at least the build up to such a market. I still think we will have another small up and down period first, probably until late September, but I may be wrong.

It seems that all I ever talk about are bull markets, bull markets, bull markets. Why does Bit Brain never focus on upcoming crypto bear markets? Is Bit Brain delusional and biased? Where are his long-term bearish predictions?
Well the short answer is that there aren't any. This is not a nonsensical statement, it is in adherence to Bit Brian's First Law of Crypto: "The crypto market is inherently buoyant and will continue upwards (for a long time to come) unless acted upon by continuous external forces that lower market value." Since I've already quoted my Fourth Law, I thought I might as well throw my First Law in there too, it's applicable to a post such as this.
Hang on tight: I'm about to formulate my brand new Fifth Law of Crypto!
"Due to the inherent buoyant nature of the crypto market, it has no bear markets. Instead, it has consolidation periods that normally include a significant but temporary market contraction."
And there you have it: Law number five.
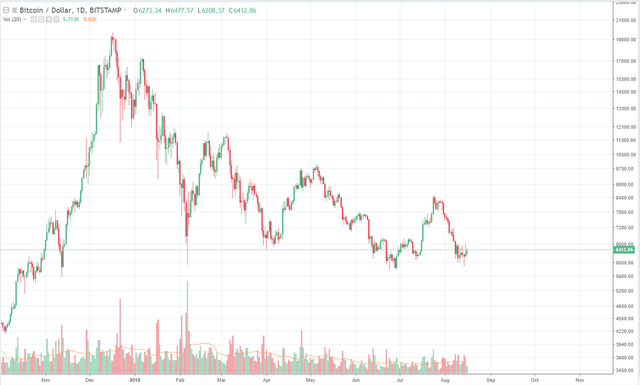
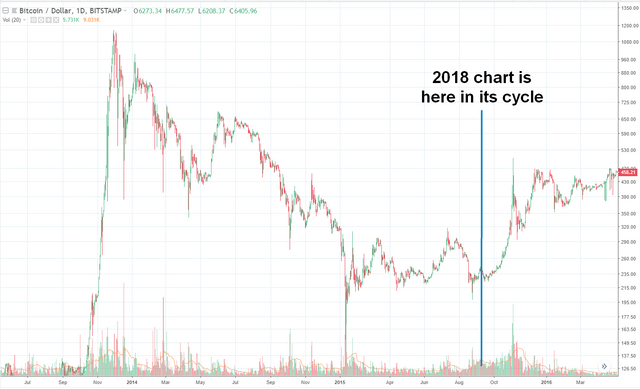
To make it easier for you to DYOR, I'm going to finish with two naked versions of the above charts. That way you can see things for yourself and decide, without the influence of my points and lines, whether or not I am right.
2018:


Both charts made by Bit Brain with TradingView
Final word:
You can follow the crowd, OR you can be right.
You can't have both.
Yours in crypto,
Bit Brain

Bit Brain recommends:
Published on

by Bit Brain


I choose not to follow the crowd and Buy Buy Buy
Good man!
The fact that most analysts are now bearish is also a great contrarian indicators that a bottom may be closer than many expect.
Absolutely!