Beginners Best Practice Guide, Tools and Tips for Crypto Asset Prediction 2018 (Part 2 of 4)
Price Range Questions
A price range question is a type of question in which you are asked to set a
price range for an asset over a certain time period. It can be the maximum and
minimum price during a particular period, open and close prices, etc. Your goal
is to try to estimate the actual minimum and maximum values during that period.

To calculate your points we are computing the sum of absolute user’s errors for
both min/max values and calculating user’s score with a correlation of the error
and specified borders. It depends on current value of the asset and its
volatility.
Range questions are the second most common kind of question on the Cindicator
platform. Currently, they come in several subtypes — weeklies, which ask the
lowest and highest price point vs BTC of a crypto asset over the course of a
week, and daily spot predictions for standard assets such as S&P 500 over the
course of a 24 hour period (sometimes a 3-day window). Although the range
questions include a variety of assets, there are some common techniques to learn
that will work well for any asset tracked with a candlestick
chart.
First off, let’s unpack the phrasing of the Freshdesk explanation, and put a
little thought into how the scoring works. As you can see, the formula for
points given starts with +75, and then calculates a number to subtract from
that. This number is found by subtracting the user input minimum and maximum
from the real min/max value of the asset. These are absolute values, so it takes
into account error either above or below the real price. This value is then
checked to see if it falls within a corridor of 0.35 * the volatility of the
asset.
To gain positive points, your answers must fall within this specific range
corridor near the actual high and low values of the asset. The size of the range
corridor is decided based on the volatility of the asset, by a proprietary
algorithm. While you cannot calculate the exact acceptable input range of any
given asset, you do know that assets with more volatility (BTC, on a day of
large movement) have more give for positive points than an asset with less
volatility. Any guesses outside of this range will generate a negative point
value.
In the end, the totals are multiplied out, and that number is subtracted from
75, giving us a total point range of +75 to -75. The figure for volatility
reflects overall price movement, not percentage movement. The basic concept is
that the more a price is moving in a day, the more leeway you have in your
guesses, so scale them accordingly.
Before going any further, make sure you are familiar with key terms and concepts — support and resistance, retracement, and identifying trends. It will go a long way to improve your understanding — not just of the Cindicator app — but also of charting more generally, which is a must if you intend to have and manage your own money in open markets.
There are many strategies you can use for answering range questions, and I will
discuss several I have used here. Which is best depends strongly on the amount
of time you want to spend. First, let’s detail the quick and dirty method. It
won’t take into account the nuances of a more advanced method, but it beats
simple guesswork.
Completing the Pattern
When I first got into asset prediction and Cindicator, it took me awhile to get
my legs. I was, and still am, learning all the ins and outs of financial markets
and the platforms used to access them. At the time, I didn’t know much beyond
the basics, but I developed my own method for answering the daily spot prices.
The same method works for weekly predictions, but only for assets with a strong
and established trend that is likely to continue throughout the prediction
window. To this day, I mainly use this method, combined with TA and charting
for the majority of my predictions.
Candlestick charts are ultimately patterns, oscillating patterns that tend to repeat again
and again, on different levels forming overall trends. Knowing this, and knowing
that what goes up must come down, we can use a quick visual analysis to give us
an idea of how to answer a range question.
For daily prices the protocol goes like this: look at the previous day bar, look
at the bar for the day. Identify if it looks as though it will be a day of
sales, or buys, and how strongly it will compare to the previous day. Looking
back through 7–10 ticks will give you an idea of how large the daily movements
are, and an idea of overall range to work with. Then complete the pattern, by
extending it into the future extrapolating from the existing trend. Often, I try
to clear my mind, cover the name of the asset and consider the chart on its own,
separate from any other knowledge I have of the asset. After I have formulated
the first guess, I then scan cryptopanic and reddit for any major news developments over the last week, taking into my mind all I know about the news sentimentregarding the asset.
Then, I make another guess and compare the two to come to a final answer. If it
has not become clear, I might further check the depth chart
on Binance, and look to see where large buys and
sells are located on the books to get a good idea of support and resistance.
I also look at the week range and note the total price change regardless of
retracement.
When using this method for daily prices, we can almost always guarantee at least half of
the points. How is this possible? Simple — by finding the bottom or top of the
trend. When looking at daily charts, we see something like this:

Here, you can clearly see the 1D candlestick in mid-trend, moving upwards after
a day of sales. In this case, we can say with a relative degree of certainty
that the lowest point of the 1D spot price from this point in the day will be
somewhere between 1.163–1.166.
Remember — the 1D charts establish movement for the entire day — so a
substantial green candle at the beginning of a day range most likely signifies a
day dominated by buyers as they push the price up the order books. The opposite
is true for a question that opens in the middle of a red candle. A red candle on
1D will set your upper range closest to the current price. A green candle will
set your lower range closest to the current price. Read the question
carefully to understand when the range in question is — there is a
latency period between when your answer is due and the range of time being asked
about. For crypto weeklies, it is most often 13 hours, but check consistently as
this may be subject to change. Also note there are different time frames for
standard assets. To more accurately establish your opening price, try opening
the 4H charts, and look back 3 ticks, (or the 2H charts and look back six ticks)
and extrapolate from there. The 1H, 30M and 5M charts are also crucial for
establishing the trending lows and highs being set by the asset in the short
term. Use all of these, and your knowledge of indicators to help set your first value.
Establishing the value further from the current trend (if high then low, if low
then high) for your prediction is significantly more difficult, but with one
side nailed down, at least you won’t be losing many points, even if you
completely miss the other. In the simplest terms, complete the pattern. Look
back at the movement of the last few days and weeks: Is the asset trending up or
down? Have there been recent large jumps? What does the pattern look like after
these moves? Is the volume rising or falling? How are the MACD lines looking? What are key support and resistance points? How does the movement of the asset work long term? All of these questions will play into the final answer.
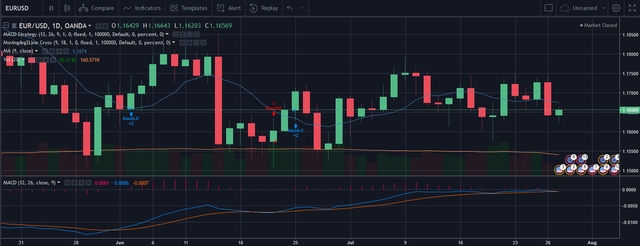
Let’s take another look at the example in question. Historically, we see a
pattern trending slightly lower over time the last 14 days, alternating patterns
of sales/buys with large moves typically happening in single days, almost always
followed by a move in the opposite direction, most often not in full reversal of the previous day. EUR is likely to find support at 1.165, as exhibited by repeat reversal at this point over the last 7 days.
You should give a little room below the support in your guess, as assets often
catch at support and turn around slowly, a little below the support line before moving up for retracement.
EUR is likely to encounter resistance at roughly 1.1665 , as shown by the past 5 days
candles, showing previous support at around that area (remember, supports become resistance and vice versa as price rises or falls). Based on this, and the MACD cross about to happen, I would put my maximum value guess at 1.166, leaving us with an
answer of: low 1.64 — high 1.1666 for daily spot prediction.
Let’s extend this logic to weeklies, to get a rough method for weekly
prediction. Consider the following chart:

We see a steady downward trend over the last seven days at least, extending back
several weeks. The volume was up slightly, but is steadily in decline along with
the price. We should expect a downward trend to continue, probably slipping and
eventually regaining some ground as buyers scramble to establish lower support.
TRX has seen nearly seven days of red candles, and some purchase pressure will
most likely be begin to occur, going by the history of the movement. My guess
was 0.00000380–0.00000450, that it might dip a little below 0.00000400, then
retrace and find support at 0.00000450.
What ended up happening was a bit different than what was predicted — TRX found
support around the 0.00000420 level and retraced a lot of the previous losses,
settling at 0.00000499. This example should show you the need to consider retracement, but also how a reasonable range can net you points without being 100% accurate. Also remember — patterns tend to repeat. If the previous week had a period of retracement, note its amount and take it into account when envisioning the pattern for the following week.
Here are a few more examples for you to follow:

From notebook(7/31): Eos is dumping along with everything else. I believe
it will hit support slightly above 0.0009 and retrace back a little bit into 9
territory, probably around 0.00095. I could be wrong, This might not be support,
it could slide more — we shall see.
As it turns out, I was wrong about the upper half by a large margin, but as you
can see, I still managed to gain 57 points due to how close the bottom guess
was. I called the lower support accurately, but failed to account for the
subsequent retracement all the way past 0.001. That is a fairly large jump in a
short time, and hard to predict, but I was close enough, and my bottom range was
only off by 160 satoshis — saving the day for the question so I could gain
significant points.

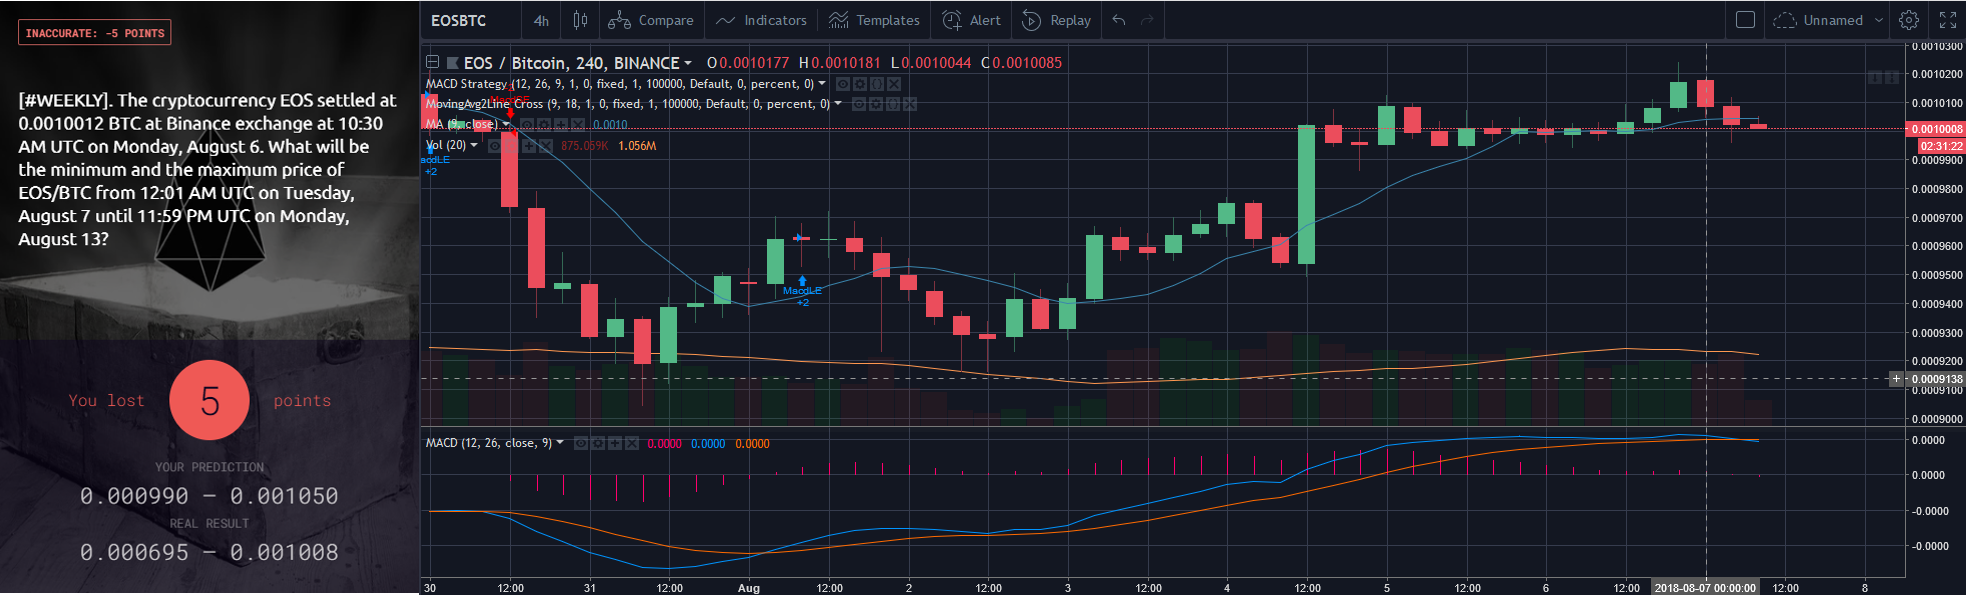
From notebook(8/6):* EOS is a great example of the 4H chart helping give us
additional information. We can see that 0.001 is truly the support for the
moment, and barring catastrophe it will probably hold. The MACD indicates upward
trend present, I think we make modest gains — 0.00099 up to 0.00105.*
Catastrophe was not barred — the support broke, leading to downward motion to
0.000695, followed by retracementto 0.001008. I would have
lost many more points if I had not stuck close to 0.001 for the upper range.
Remember, a support becomes resistance once crossed, which was certainly the
case here.
Price range prediction is not easy, and the further out in time you go the more
difficult it becomes. However, if you take time to break down the steps,
understand the principles, and practice your methods — in short order you will
be understanding price movement to a much greater degree than the average
investor. This in turn will give you more insight to apply to your trades.
Glossary of Terms
Market Sentiment
“Market sentiment is the overall attitude of investors toward a particular
security or financial market. Market sentiment is the feeling or tone of a
market, or its crowd psychology, as revealed through the activity and price
movement of the securities traded in that market. In broadest terms, rising
prices would indicate bullish market sentiment, while falling prices would
indicate bearish market sentiment.”
Retracement
“A retracement is a temporary reversal in the direction of a stock’s price that
goes against the prevailing trend. For example, a retracement in an uptrend is a
brief period of selling before the uptrend continues, also known as a dip.”
- https://www.investopedia.com/terms/r/retracement.asp
- https://www.investopedia.com/ask/answers/05/fibonacciretracement.asp
Support/Resistance
“Support is the price level at which demand is thought to be strong enough to
prevent the price from declining further. The logic dictates that as the price
declines towards support and gets cheaper, buyers become more inclined to buy
and sellers become less inclined to sell. By the time the price reaches the
support level, it is believed that demand will overcome supply and prevent the
price from falling below support.
Support does not always hold and a break below support signals that the bears
have won out over the bulls. A decline below support indicates a new willingness
to sell and/or a lack of incentive to buy. Support breaks and new lows signal
that sellers have reduced their expectations and are willing sell at even lower
prices. In addition, buyers could not be coerced into buying until prices
declined below support or below the previous low. Once support is broken,
another support level will have to be established at a lower level.
Resistance is the price level at which selling is thought to be strong enough to
prevent the price from rising further. The logic dictates that as the price
advances towards resistance, sellers become more inclined to sell and buyers
become less inclined to buy. By the time the price reaches the resistance level,
it is believed that supply will overcome demand and prevent the price from
rising above resistance.
Resistance does not always hold and a break above resistance signals that the
bulls have won out over the bears. A break above resistance shows a new
willingness to buy and/or a lack of incentive to sell. Resistance breaks and new
highs indicate buyers have increased their expectations and are willing to buy
at even higher prices. In addition, sellers could not be coerced into selling
until prices rose above resistance or above the previous high. Once resistance
is broken, another resistance level will have to be established at a higher
level.”
- Technical Analysis of Stock Trends, Vol 10, Macgee and Edwards
- https://www.investopedia.com/trading/support-and-resistance-basics/
Trends (identifying)
“The trend is the general direction of a market or of the price of a security.
In technical analysis, trends are identified by trendlines that connect a series
of highs or lows. Most traders trade in the same direction as a trend, while
contrarians seek to identify reversals. Trends can also apply to interest rates,
bond yields, and other markets where they’re characterized by a long-term
movement in price or volume.”
Candlestick Chart
“Just like a bar chart, a daily candlestick shows the market’s open, high, low
and close price for the day. The candlestick has a wide part, which is called
the “real body.” This real body represents the price range between the open and
close of that day’s trading. When the real body is filled in or black, it means
the close was lower than the open. If the real body is empty, it means the close
was higher than the open.”
These are the standard charts you see an all forex and crypto exchanges. They
are preferred by traders and predictors to the standard line chart because they
convey more information. Of particular note is the time period. You will note in
the top left corner of the tradingview display, there is a box that says 1D
(typically). You will find this same box on binance and most crypto excahgne
windows. If you click it, you can change the period. 1D means one day. You can
change it to 1 hour, 4 hours, 1 week. The important thing to remember is that
whatever you set it to, each candle represents one of those periods.
Technical Analysis
“Technical analysis is a trading discipline employed to evaluate securities and
identify trading opportunities by analyzing statistics gathered from trading
activity, such as price movement and volume. Unlike fundamental analysts, who
attempt to evaluate a security’s intrinsic value, technical analysts focus on
charts of price movement and various analytical tools to evaluate a security’s
strength or weakness.”
Books
- Technical Analysis of Stock Trends, Tenth Edition Magee and
Edwards - Elliott Wave Principle: A Key to Market
Behavior - Candlestick Trading
Bible
Tools
- https://athda.com — All time high data
- https://www.coinmarketcap.com/ — your new
bible - https://www.tensorcharts.com/ — excellent
charting w/heat map functions - https://coinfarm.online/index.asp — lot of
useful information, including long/short option statistics on bitmex - https://blockchainwhispers.com/bitmex-position-calculator/
— slightly off topic, useful for leveraged trading - http://www.coindominancecharts.com/ —
useful for rank questions - http://data.bitcoinity.org/markets/books/USD#
— Various order books - https://agile-cliffs-23967.herokuapp.com/binance
— Volume indicator for binance, leave it open for a second and data will start
to accumulate - https://www.tradingview.com — get a membership
- https://www.cryptopanic.com — best sentiment /
news aggregator - https://t.me/cindicator_chat — Cindicator
Telegram link - https://t.me/cryptiverse — Cryptiverse Chat Channel
link
Reading
- https://www.hussmanfunds.com/content/comment/
— lots of good commentary, mostly on standard markets but even handed and
insightful - https://www.binance.vision/ — binance educational
page - https://stockcharts.com/school/doku.php?id=chart_school
— lots of information on charts, terms etc. - https://telegram.me/joinchat/AAppPT3cOnM48-Kqbm7FGg
— traders library chat channel - https://www.tradingview.com/ideas/indicator/
— tradingview explains indicators - https://www.investopedia.com/articles/active-trading/041814/four-most-commonlyused-indicators-trend-trading.asp
— another indicator explanation page
Come talk predictions on Cindicator Telegram:
PART 1 LINK!
PART 3 COMING SOON!
Congratulations @seraphismith! You received a personal award!
You can view your badges on your Steem Board and compare to others on the Steem Ranking
Do not miss the last post from @steemitboard:
Vote for @Steemitboard as a witness to get one more award and increased upvotes!