QTUM:BTC - Latest Technical Analysis!
Hello and welcome to my latest QTUM vs BTC analysis on the daily log chart.
.png)
As you can see we are currently testing the 23.6% Fib levels resistance. We last tested the resistance of this level after the massive green candle that occurred on the 19th of March; in which we ultimately failed to break through it and started to trade sideways in a channel. At the time of the massive green candle we were well below the 26 EMA and 12 EMA ; whereas the difference now is that we had a bullish crossover occur on the 18th of April; and have since confirmed both EMAs as support. This is a good looking sign for things to come!
The MACD has is currently trading above the signal line and although momentum is low, it is slowly building to the upside. RSI is signaling that there is some strength in a move further to the upside building. Likewise, Aroon Up crossed over the Aroon Down line in a bullish manner back on the 13th of April. These three indicators combined are suggesting a bullish move up and out of the 23.6% is likely imminent if we can get some more strength and momentum going.
From a pattern perspective we are forming a potential cup and handle pattern which if completed would take us up as high as the 38.2% Fib level. Now once we are there; the 38.2% Fib level is not likely to give us much trouble. This is because although we tested it as confirmed resistance back on 27/02, volume was low and we were also in a clear down trend at that time. With volume , we should blast through its defenses and head straight to the 61.8% Fib level which has a bit more resistance behind it.
It is also worth noting that we have a potential three inside up candle pattern emerging on the daily chart , denoting with high reliability of a bullish reversal.
From my perspective (although I am bullish ) I am waiting for a confirmed break out above the 23.6% Fib before going long. There is still a slight chance we could fall further down and create a double bottom before the run up to test the 61.8% Fib level (this is crypto after all!) which is why it is always important to wait for confirmation before placing a trade.
Anyways happy and safe trading and don’t forget to follow me for regular updates!
Cheers
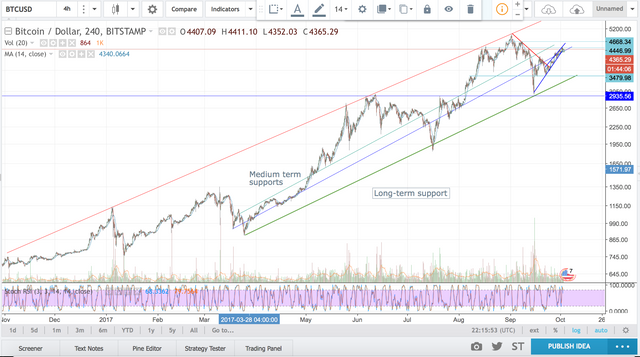
Now one final note as a caveat: I just wanted to mention why I use the log scale when so many other analysts use the linear scale. In the crazy and highly volatile crypto world we often see huge percentage changes. A linear scale chart is not likely to show a lot of relevant patterns as compared to the log scale, especially when we are analyzing long-term trends. As an example we will have a quick look at BTC on the four hour log scale chart:

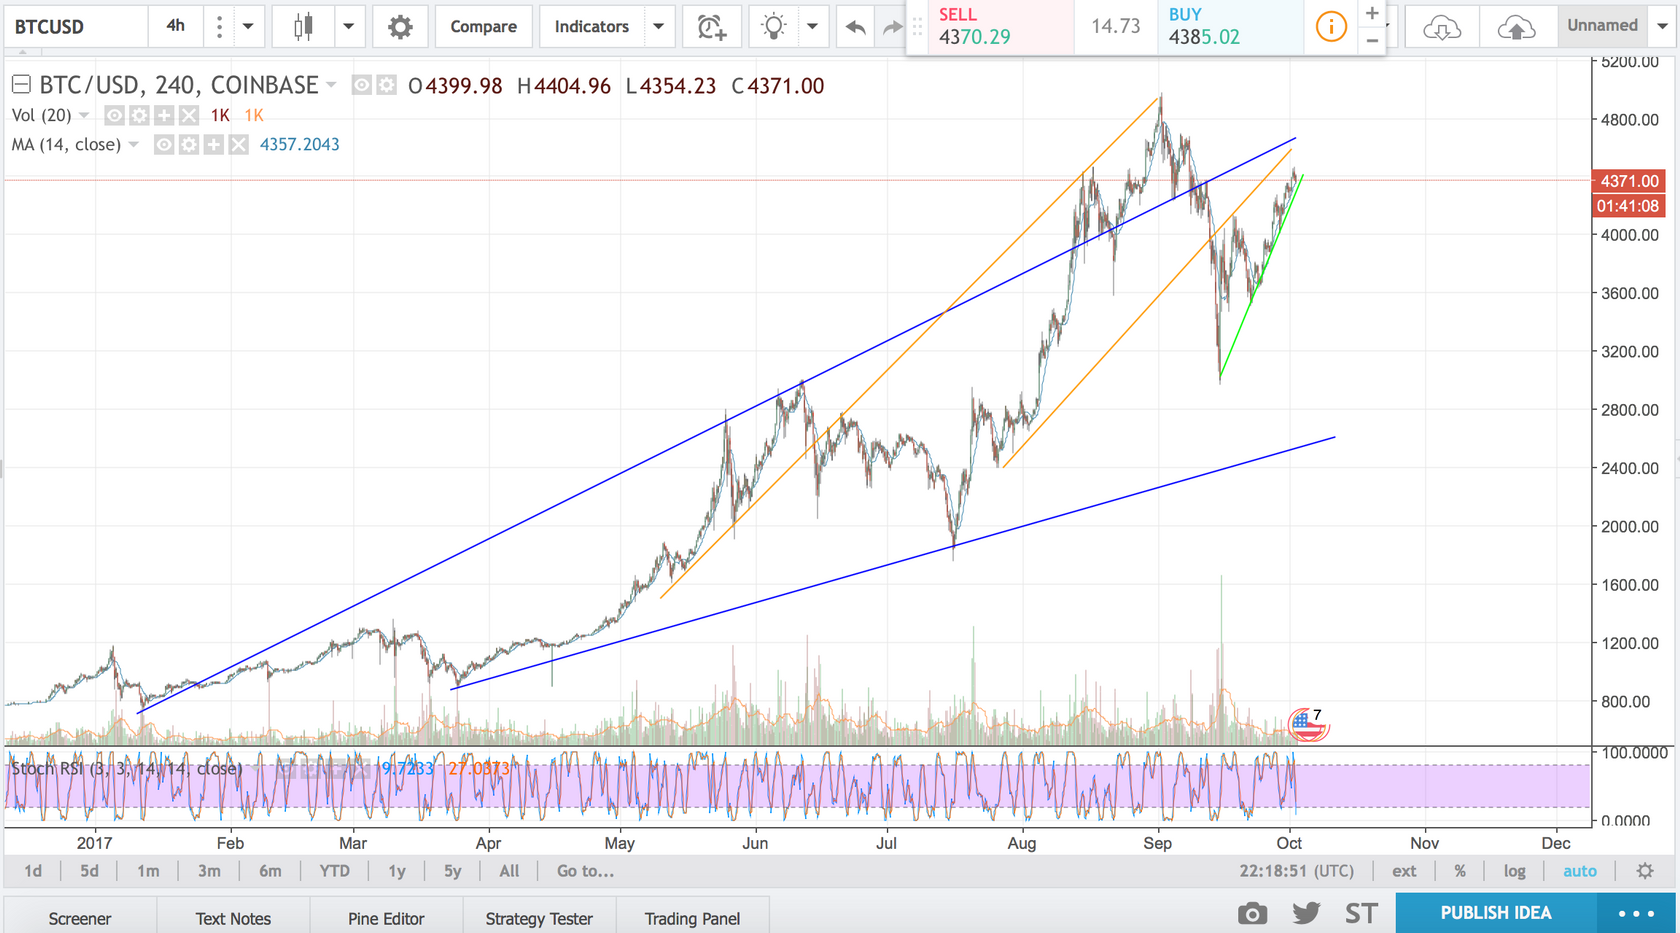
And compare it to the four hour linear chart:

Both these charts represent the exact same data; the only thing that we are changing is switching from linear scale to log scale – effectively changing the y-axis. As you can see the log-scale chart shows a much cleaner look and provides us with more accurate predictions on trend lines, especially in a volatile environment such as crypto. If Bitcoin drops $445 it may seem like a huge amount, however when we compare it to today’s price it actually only represents a 5% drop. By using the log scale it mitigates this large linear change and instead focuses on the percentage change.
By comparing the charts above it is clear that BTC was likely to drop within the uptrend channel on the log chart, whereas the linear scale showed an apparent breakout of the uptrend channel that was forming. Therefore it is clear that the log scale allows for big linear changes in a less extreme and more correct manner.
It is worth noting that linear data is still good to draw lines and see trends, however more so from a shorter term viewpoint. This is due to the changes in short time frames being nowhere near as extravagant as compared to the long-term. So, in essence it is still important to look at both when considering an overall holistic viewpoint of a trend. Furthermore, there are definitely a few patterns and trends that are more visible in the linear scale chart than the log-chart.
To conclude, I perform the majority of my analysis using the log scale chart as I like to compare the percentage change over the absolute change in value of it. I still look at the linear charts to check if I may have missed a pattern and to predict what the majority of the market is potentially looking at.
Cool, following you. Whats your current favorite coin/token?
Thanks so much! I am new to steemit so this sort of feedback keeps me posting! I am (to be honest) pretty disheartened by some of the so called 'analysts' in here making huge amounts of money off a large following with their own best interests at heart (basically very poor analysis with no real basis a lot of the time aside from providing 'hope' to their huge following). I seek to change this and give a full honest account of where we are currently trading at and the next steps to wait for before deciding how to trade. Often this involves a breakout which is common across forex, crypto, asx, futures etc etc trading that many analysts on here do not even mention (or possibly actually know!). The difference with me is that I want to make my followers money and not make money off them. Now I am sorry for this rant, so to answer your question - I do not really have a favorite coin or token. I will basically trade any coin so long as it is going to make us money! :) It's worth noting I work as a full time analyst for an oil and gas company that is listed within the top 20 ASX of Australia, so I do have some pedigree (if you can call it that?!). Thanks again and thanks for following!