The Current Bitcoin Cycle - Are You Ready?
Bitcoin
Like we all know by now Bitcoin has cycles and most refer to it as bubble cycles. In my previous posts, I've managed to pull the historic bitcoin price data and made a first attempt to analyze the data in an attempt to find the current cycle trendlines. My previous posts on this can be summarised as follows:
- Pulling the bitcoin historic price data for the past 10 years - Bitcoin Historic Price Data
- First attempt at finding the trend - Bitcoin - A Critical Analysis
Bitcoin Cycle
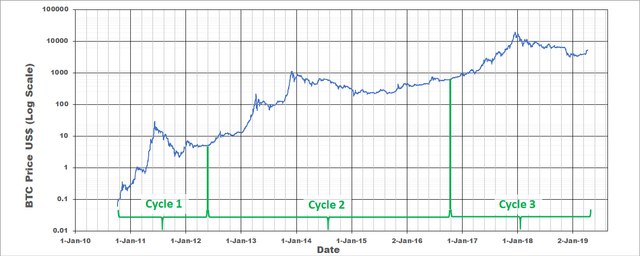
We determined that BTC has gone through 2 cycles and it is currently in its third cycle as seen in Figure 1
Figure 1 - BTC Cycles
Bitcoin Previous Trends
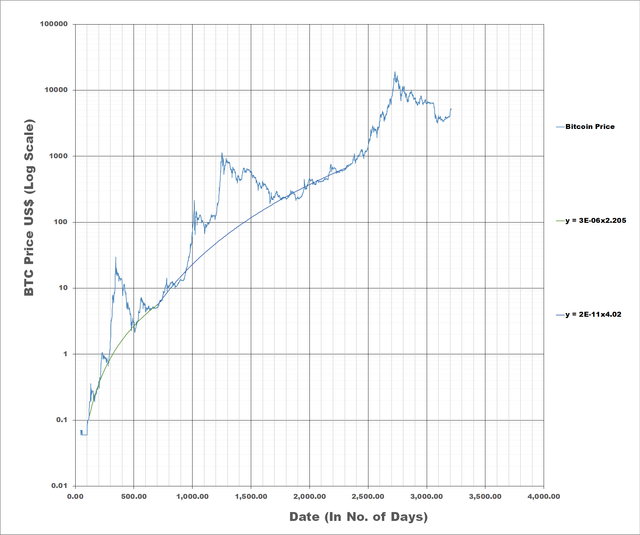
We change the x-axis of Figure 1 from days (in date format) to units where 1 unit represents 1 day. The bottom of the cycles can now easily be determined and the trend lines are as follows (you can plot it yourself by replacing x with days in excel, refer to Figure 2):
- Cycle 1 - y = 3E-06x2.205
- Cycle 2 - y = 2E-11x4.02
Figure 2 - BTC Price from July 2010 - Cycle Trendlines Corrected
Bitcoin Current Trend
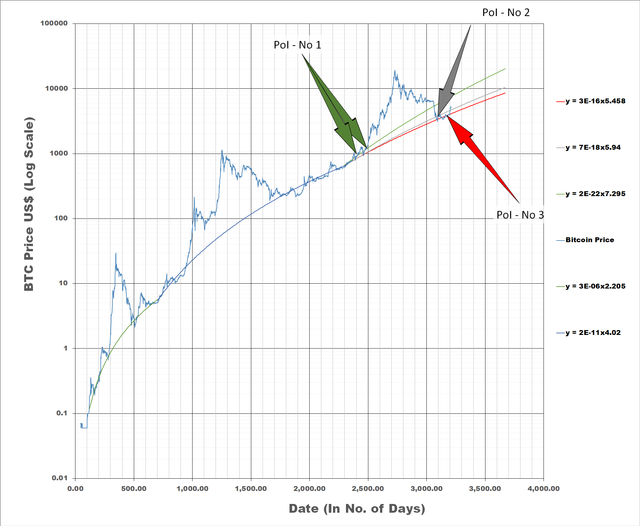
The current trend for BTC is anyone's guess but we can try and get something from the data and some trends lines can be identified. From Figure 3 we can see three Points of Interests (PoI) that gives the followings trends:
- POI No. 1 - y = 2E-22x7.295
- POI No. 2 - y = 8E-19x5.93
- POI No. 3 - y = 3E-16x5.458
Figure 3 - BTC Current Cycle - Points of Interest
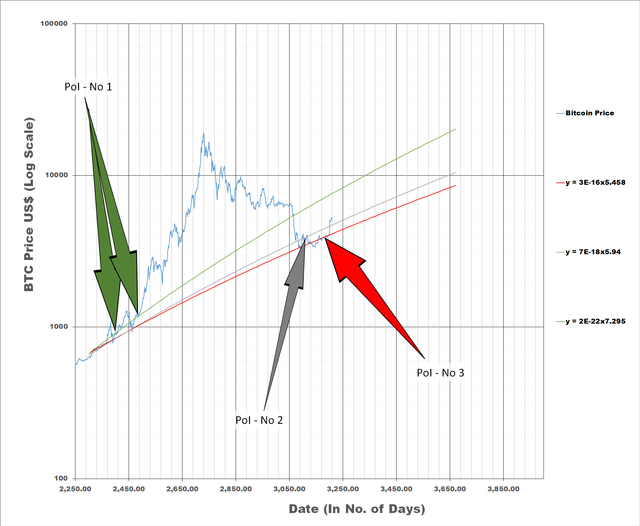
If we cut down Figure 3 to show the current cycle more clearly we see the PoI's with the possible trend lines as seen in Figure 4. The trendlines for PoI No. 1 - 3 as listed above still applies.
Figure 4 - BTC Current Cycle Points of Interest - Cut Down
Bitcoin Possible Price Band
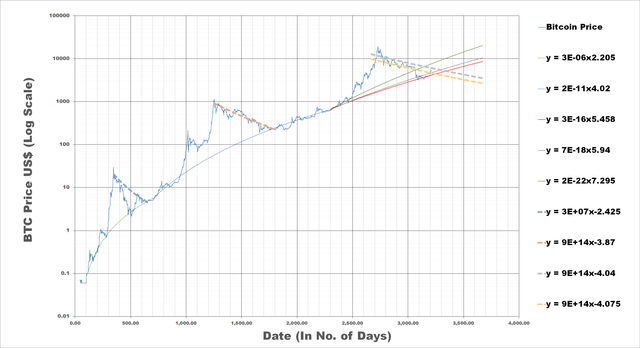
Based on previous downward trends it seems that we have reached the lowest point for bitcoin and was perhaps a few thousand US$ below the trend which would have been the best time to buy. Figure 5 shows that the Down Trends (DT) flatten out more after each cycle and DT No 1 - 2 trend lines are as follows:
- DT No 1 (Cycle 1) - y = 3E+07x-2.425
- DT No 2 (Cycle 2) - y = 9E+14x-3.87
Except for some possible quick sell-offs or price jumps which most likely will not last long at the current time, it is expected that Bitcoin should hold between US$5000-US$7000 towards the end of 2019 as seen in Figure 5.
Figure 5 - BTC Current Cycle Possible Price Band
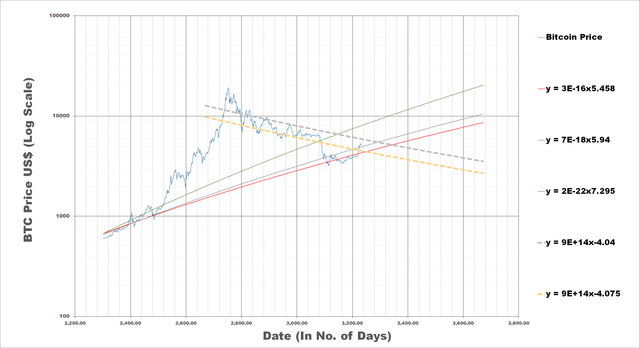
We can blow up Figure 5 above and focus on the current cycle as seen in Figure 6. The Current Possible Down Trends (CPDT) for this Cycle are as follows (as seen in Figure 6):
- CPDT No 1 - y = 9E+14x-4.04
- CPDT No 2 - y = 9E+14x-4.075
Figure 6 - BTC Current Cycle Possible Price Band - Cut Down
Conclusions
Based on the lower bound trend of the price and the DT for the current cycle we might drop back to a level between US$4500-5000. From Figure 5 - 6 it does, however, look like we are reaching the inflection point for this cycle. That's if we have not already passed the inflection point.
For some inspiration here is a video by Max Right (Contrarian Dude):
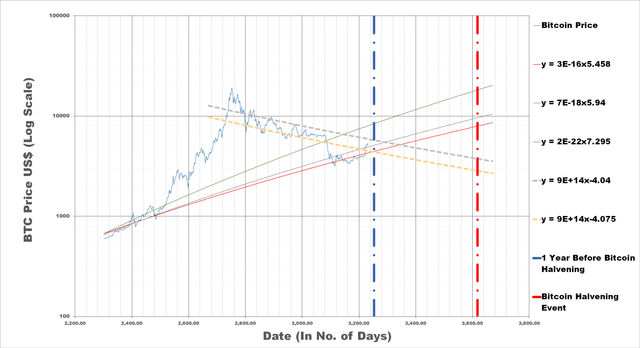
Some additional important information is the upcoming Bitcoin Halving Event in May 2020. Max Right also mentions that historically, one year before the halvening event we normally start to have the first horders of BTC collecting for the coming bubble. This will lead to a two-step price increase as follows:
- Step 1 - is a 300% increase starting one year before the Halvening event until the halvening event.
- Step 2 - 20x increase within one year starting from the date of the halvening event
Figure 6 above can be updated to show the Data of the halvening event as well as the expected time that bitcoin will reach its bottom, which is one year before the halvening event (Refer to Figure 7).
Figure 7 - BTC Current Cycle Possible Price Band
Let's hope for one last drop in the price before May 2019 so that we can capitalize on the last time that bitcoin will ever be close to US$3000 again.

Consider donating should this post have been of value:
BTC - 18atWSWrN2bDxNWeoc3Q68coQBEk69FvUY
ETH - 0x71844057eec156843af64b2b8021daf3615b0e06
LTC - LPji8igXQ1cqjhZDFZUYgEWvVshGVi4AA1


PREsearch (My referral) - https://www.presearch.org/signup?rid=454926