Bitcoin - A Critical Analysis
Bitcoin Data
A few days ago, I managed to pull Bitcoin price data from as far back as 2010. I specifically wanted to write a post analysing Bitcoin market movement to look at the predicted trends going around on the internet. I provided the data for free in my previous post which you can find here.
Current Chart
Normal Chart
Using the data, we can generate the chart as seen in Figure 1 below which have the following properties.
- Y-axis - Bitcoin Price in US$
- X-axis - Date
- Start date - 17-July 2010
- Lowes Price - US$0.05
- Highest Price - US$19110.24
Due to the small price, BTC started out as it is difficult to draw any conclusion from this chart. One can barely see the small jump at the beginning of 2013 and would think that the jump in 2014 is almost irrelevant. From 2014 to 2018 the line looks almost smooth except for small dips and jumps.
Figure 1 - BTC Price from July 2010

Log Scale
If we plot the data on a logarithmic y-axis to compensate for the small price BTC started out at, a different picture comes to light as seen in Figure 2. Four tops were reached in the data to date as follows:
- Mid 2011 - Max of US$29.53
- Beginning 2013 - Max of US$214.86
- End 2013 - Max of US$1132.29
- End 2017 - Max of US$19110.24
We leave out Top 2 due to the assumption that it is an anomaly.
Figure 2 - BTC Price from July 2010 (Price on Log Scale)

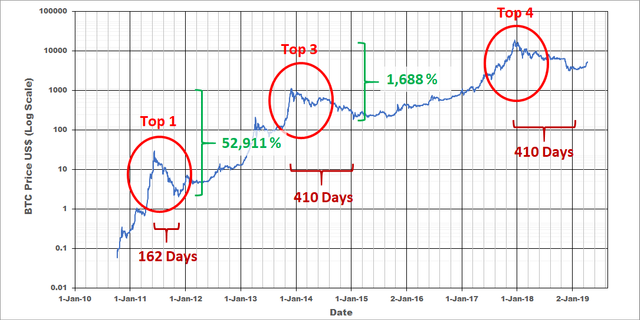
Looking at the remaining Tops in Figure 3 we can make the following conclusions:
- From Top 1 it took 162 days to reach the bottom before the price flattened (18 November 2011)
- From Top 3 it took 410 days to reach the bottom before the price flattened (14 January 2015)
- From the bottom, after the crash of Top 1, the price increased with 52,911 % to the height of Top 3 end of 2013.
- From the bottom, after the crash of Top 3, the price increased with 1,688 % to the height of Top 4 end of 2017.
With the massive Mt Gox scandal during the Top 3 jump, it is difficult to say whether the data during this time is useable. Once this coming cycle has run its course it will be easier to draw conclusions for this time period. Have we reached the bottom for this cycle yet? I guess only time will tell but if we assume that it takes 410 days like for the previous Top 3 cycle, we are long past that point as seen in Figure 3.
Figure 3 - BTC Price - Remaining Tops

Trends
Seeing a trend currently is difficult but I'm sure we will be able to make out a lot more after the coming cycle. A stab in the dark for this post as follows:
- Assuming we have reached the bottom after Top 4 at US$3200 because we are past 410 days from the peak
- Assuming we will see no less than 1,688 % increase from this bottom
- The price predicted for the next jump is estimated at US57,208.04 (This is, however, a very rough estimate. I will present some more interesting graphs in the next post)
Future Topics
BTC - Log vs Log Scale Graph
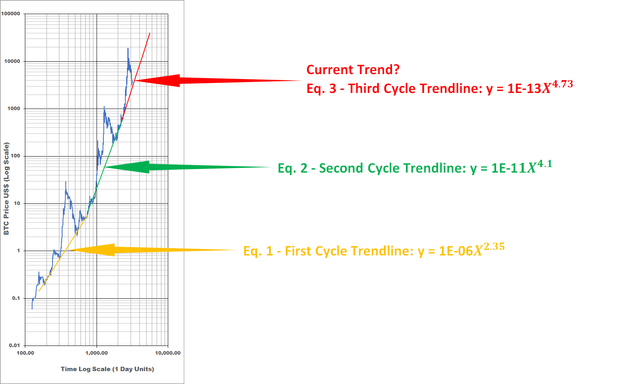
On a Log-Log graph (refer to Figure 4), there seems to be only one direction Bitcoin is going in as seen in Figure 4. Trends can be seen on the lows and from the first, to the second cycle there seems to be a slight increase in the trend. The graph was generated using 1 day as 1 unit on the x-axis starting from 17 July 2010. This is probably not a good chart to look at to estimate the price of BTC but this is the graph I use to generate the formulas for the different possible trend lines.
The formulas for the trends are as follows:
- Eq. 1: y = 1E-06*X^(2.35)
- Eq. 2: y = 1E-11*X^(4.1)
- Eq. 3: y = 1E-13*X^(4.73)
Figure 4 - BTC Price - Log-Log Scale

Possible Trendlines
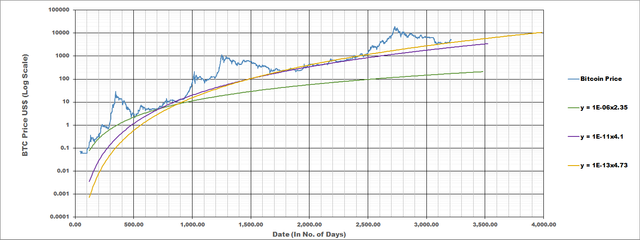
Using the trendline equations above Figure 5 is generated on a Log Scale for the price only with the x-axis in number of days from 17 July 2010.
Summary:
- Green Line for the first cycle
- Purple Line for the second cycle
- Yellow Line for the current cycle - Note: perhaps the trend should pick up a bit to fall exactly on the low for the end of the second cycle? Guess I'll leave something to write about in the next post :-)
Figure 5 - BTC Price Possible Trend Lines

If you want the data, I have in excel format drop your email in the comments and I'll send it to you.

Consider donating should this post have been of value:
BTC - 18atWSWrN2bDxNWeoc3Q68coQBEk69FvUY
ETH - 0x71844057eec156843af64b2b8021daf3615b0e06
LTC - LPji8igXQ1cqjhZDFZUYgEWvVshGVi4AA1


PREsearch (My referral) - https://www.presearch.org/signup?rid=454926