Good News For BOTH Bulls and Bears in Crypto!
If you’d rather see this presented in video form, you can view the replay of the live stream I host every Sunday night:
The past few weeks have been good to us, and I think that will continue for a few more as well!
But afterwards, we’ll have to keep a close watch because there is a chance (quite a big one, in fact) that this correction has not yet completed and that new lows are in the cards.
Here’s the daily chart:
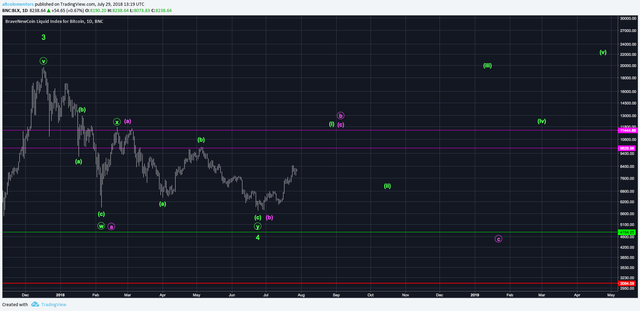
In the past week, the price action has shown itself as impulsive, so I’ve removed the two immediately bearish alternatives and we are left with two possibilities: that we are on our way to new all time highs (green) or that we get rejected by resistance and head down to new lows (pink).
The resistance levels to watch are the previous rejection areas at $9800 and $11500. I will be taking significant profit on any weakness I see close to those levels. The structure of the decline will be the main factor in differentiating which scenario to expect. I will call it out when we get there.
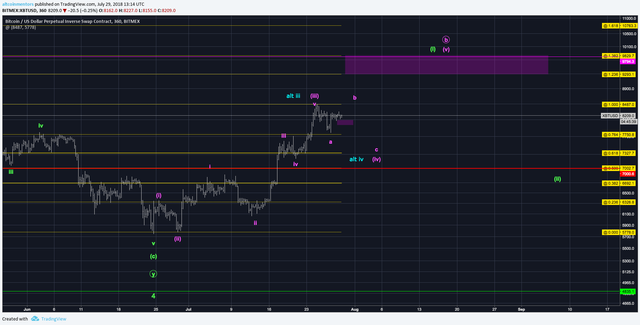
On the 6 hour chart, you can see that the target zone for the next leg up is right around the $9800 resistance I mentioned earlier.
It is possible that I am off by a degree and have included the blue alternate to reflect that. This alternate is more bullish and leads to the higher resistance at $11500.
Either way, the level that the bulls shouldn’t give back now is $7000. Below this and I have to bring back the bearish alternatives I showed last week. But I don’t expect this to happen.
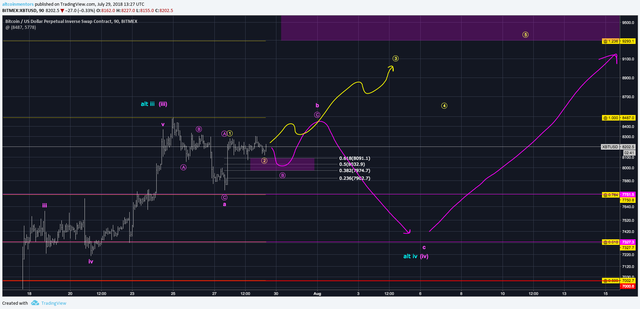
On the 90 minute chart, note the immediately bullish case in yellow. While it would be more “conventional” to see the rest of the pink play out, Bitcoin has a habit of staying shallow in 4s and accelerating in 5s.
Because of this, I am positioned long with both my long term holdings and with short term leverage. My stop loss for short term trades is under the swing low at $7780 and I will be hedging my long term positions if the price gets under the $7000 level mentioned above.
A few weeks ago, I showed the chart of correlations across different crypto pairs reaching all time highs. Since then, we’ve seen a decoupling, though not the decoupling that many would have wanted.
Alt:USD pairs have been rangebound during Bitcoin’s breakout with new lows being created by Alt:BTC pairs. This is one of the main reasons why I lean towards the side of the correction not being done yet. In a bullish market cycle in the past, we’ve seen Bitcoin breakout while Alt:USD pairs follow and Alt:BTC pairs stay rangebound.
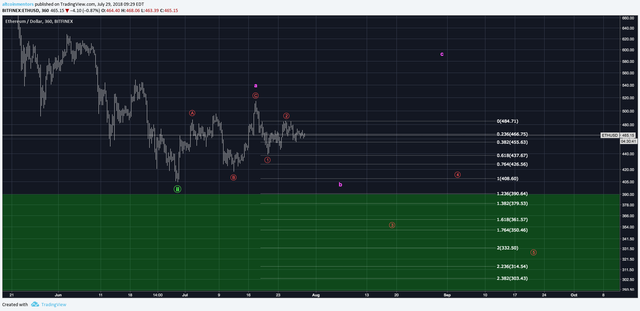
This is the Ethereum USD chart. It is VERY hard to call this bullish since the price action is so overlapping. It’s possible to see a brief rally to the high $500s, but a breakout beyond that is unlikely.
Many other altcoins looks like this as well with only a few looking potentially bullish like Bitshares, Chainlink, and 0x. But even among those, the setup for a breakout is being challenged.
I will continue to watch closely for something bullish to emerge to change my mind.
If this analysis has been helpful and you want to receive it in your inbox every Sunday, you can sign up at https://altcoinmentors.com/strategy. If you would like to support us, please upvote and share this article with someone else who would find it useful!
To keep up with us during the week, we have a Telegram Channel where we post charts, market updates, and trade ideas every day! You can join by going to https://t.me/altcoinmentors.
Happy trading!
Charlie You
Altcoin Mentors, Inc.
twitter.com/iamcharlieyou
twitter.com/altcoin_mentors
Congratulations @charlieyou! You received a personal award!
Click here to view your Board
Do not miss the last post from @steemitboard:
Congratulations @charlieyou! You received a personal award!
You can view your badges on your Steem Board and compare to others on the Steem Ranking
Vote for @Steemitboard as a witness to get one more award and increased upvotes!