BuildTeam: A Deeper Look Into Statistical Data and Analysis for the BUILDTEAM Token in 2018
Hey folks! A few days ago we put up a post which showed the development of the BuildTeam token staking payout, but, we thought a clearer explanation on how we calculated these numbers would be in order. Feel free to review our last post before moving forward BuildTeam Token Metrics Part 1.
We'll go into greater detail about the data used to compile our last article for readers now.
Data:
First of all, we started with the following data:
| Date | Steem/BT |
|---|---|
| Sat Dec 16 | 0.272 |
| Mon Jan 1 | 0.263 |
| Tue Jan 16 | 0.172 |
| Thu Feb 1 | 0.205 |
| Fri Feb 16 | 0.125 |
| Thu Mar 1 | 0.091 |
| Fri Mar 16 | 0.073 |
| Sun Apr 1 | 0.073 |
| Mon Apr 16 | 0.087 |
| Tue May 1 | 0.151 |
| Wen May 16 | 0.125 |
The data above represents the payout dates since December and the amount of Steem we distributed compared to the amount of BuildTeam Tokens staked at the time.
In the next step we had to figure out the prices at the time of the payouts.
For this we went to CoinMarketCap and checked out the prices of Bitshares and Steem at the day of the payout.
At the same time we also checked the price of the BuildTeam tokens on bitshares.
This data enabled us to calculate the price of the BuildTeam Token in $ at the day.
| Steem price (USD)* | BT price (BTS)* | BTS price (USD)* | BT Price (USD) |
|---|---|---|---|
| 2.1 | 30 | 0.35 | 10.5 |
| 4.22 | 34 | 0.71 | 24.14 |
| 4.8 | 25 | 0.38 | 9.5 |
| 4.6 | 33 | 0.44 | 14.52 |
| 4.4 | 38 | 0.26 | 9.88 |
| 3.4 | 46 | 0.23 | 10.58 |
| 2 | 48 | 0.15 | 7.2 |
| 1.5 | 41 | 0.12 | 4.92 |
| 2.7 | 31 | 0.2 | 6.2 |
| 3.7 | 32 | 0.35 | 11.2 |
| 2.8 | 26 | 0.24 | 6.24 |
Following this data we used a very simple formula.
Steem Price * Steem share / BuildTeam Token Price
Which got us the ratio of how many Steem in $ everyone got, compared to the BuildTeam Token Price staked.
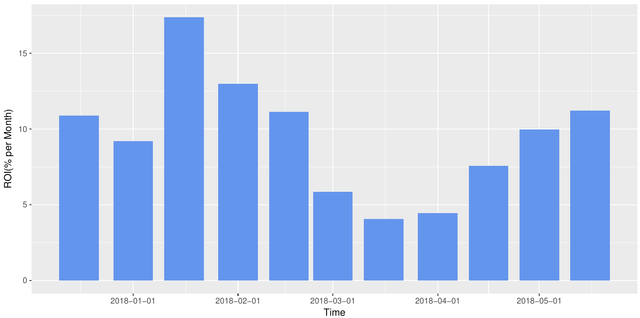
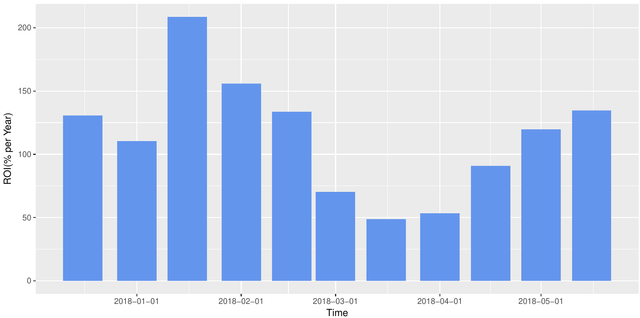
Calculating this times two (Two payouts per month) gets us the monthly ROI and times twelve the yearly.
| ROI (% per year) | ROI (% per month) |
|---|---|
| 130.56 | 10.88 |
| 110.34 | 9.19 |
| 208.57 | 17.38 |
| 155.86 | 12.98 |
| 133.60 | 11.13 |
| 70.18 | 5.84 |
| 48.66 | 4.05 |
| 53.41 | 4.45 |
| 90.92 | 7.57 |
| 119.72 | 9.97 |
| 134.61 | 11.21 |
Data representation:
Resulting in the two following graphs.
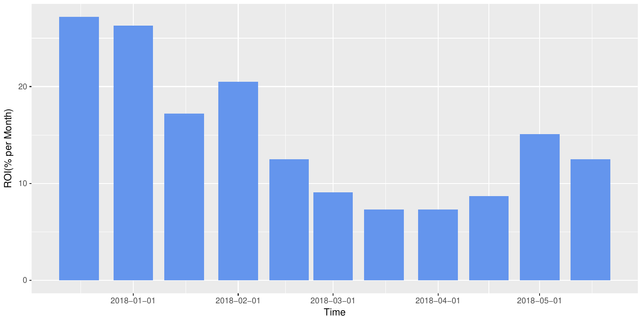
Additionally, some people asked for a graph not considering the BT price at all.
This would be quite difficult since in order to get these numbers we had to fix the BT value on some number.
Therefore, a better representation would be the data in the first table.
This shows how many Steem for each BT was paid out.
Which shows a quite similar curve as the other graphs, but independendt of the Steem and BT token price.
How we generated the Graphs: (Scripts)
To get some nice looking graphs we loaded the Data into R.
To get the data from the clipboard:
Dataset <- read.table("clipboard", header=TRUE, sep="", na.strings="NA", dec=",", strip.white=TRUE)
To cast the date column to actual dates:
Dataset$Date <- as.Date(Dataset$Date, format = "%d-%m-%Y")
To make the bar graph for the year:
graph = ggplot(Dataset, aes(x=Date, y=ROI, fill="cornflowerblue")) +
geom_bar(position=position_dodge(), stat="identity", fill="cornflowerblue") +
xlab("Time") + ylab("ROI(% per Month)") +
theme(legend.text=element_text(size=15), legend.title=element_text(size=20), legend.position="none") +
scale_x_date(date_breaks = "1 month")
The first line loads the graph from the Dataset.
The next line defines the type of graph and color.
The following line names the axis.
The next line cleans up the sizes of the legend.
And the last line defines the date scale.
In conclusion we would just like to quickly remind everyone of the fact that BUILDTEAM has offered an outstanding ROI this year to both inside and outside parties and would like to highlight that ROI again in the chart below:
What does it all mean for BuildTeam?
As you can see from looking at the chart above payments / ROI declined over March and April which also tracked a major correction of the overall cryptospace in which every major cryptocurrency faced a massive decline of 20-80pct.
Another apparent observation is that payments / ROI has a new trend increasing significantly in the end of April 2018 and mid May 2018.
BuildTeam has an incredibly ambitious roadmap for 2018 which involves major updates to some of our flagship services and a possibility of getting involved with brand new projects involving the new EOS mainchain due to release on June 1, 2018.
Stay tuned for some exciting news! Thanks for supporting BuildTeam!
Join our Discord chat
Get support and connect with us and other BuildTeam fans!

We are always looking to improve @buildteam and try to keep you up-to-date whenever something changes. If you have any suggestions about what we should change or add to @buildteam, then please drop by and let us know!
Missed the BuildTeam announcement? Here's all the juicy details.

Visit our flashy new website BuildTeam.io!
Set @buildteam as your witness proxy today and contribute to building a better tomorrow!
Want an easier way? Use our SteemConnect proxy link!
This is a @steemvoter subscription payment post. Thank you to Steemvoter customers for allowing us to use your Steem accounts to upvote this post by virtue of your free subscription to the Steemvoter.com bot service. @steemvoter is proudly a @buildteam subsidiary and sister project to @steemsports and @minnowbooster.


Thanks for this update @buildteam and @cryptomancer!
I have a questions regarding SBD. Since SBD is decreasing potentially going towards $1 USD, I see that is affecting the amount of Steem that Buildteam gets when converting the SBD to Steem. Am I thinking correct?
Also analysing the graphs and tables, and past payouts, the ratio price of SBD compared to Steem, as well as the price of BTS and Steem, also impact on the price of BT and the amount of Steem distributed to token holders, correct?
Looking forward to your thoughts on this.
Regards, @gold84
So many ways to invest in Steemit... so little money to go around. This is definitely intriguing and I will take a closer look at the shares market.
Thanks for your post. The lowest ROI is 4%. It is better than 3% of steemit. Assume that SBD and Steem prices are stable.
If I believe that the statistics are very accurate, recently I received some signs that certify it.
BuildTeam: A Deeper Look Into Statistical Data and Analysis for the BUILDTEAM Token in 2018 has been successfully resteemed by the mystical @resteemmuse
Great Information. Thanks for sharing :p
afternoon
Great one. Keep it up @buildteam
I'll have to review this content for sure. I'm interviewing one of your guys in a week or two on my DEAR LITTLESCRIBE show. Thanks for sharing the update!
so nice post but me new plz all friends upvote me