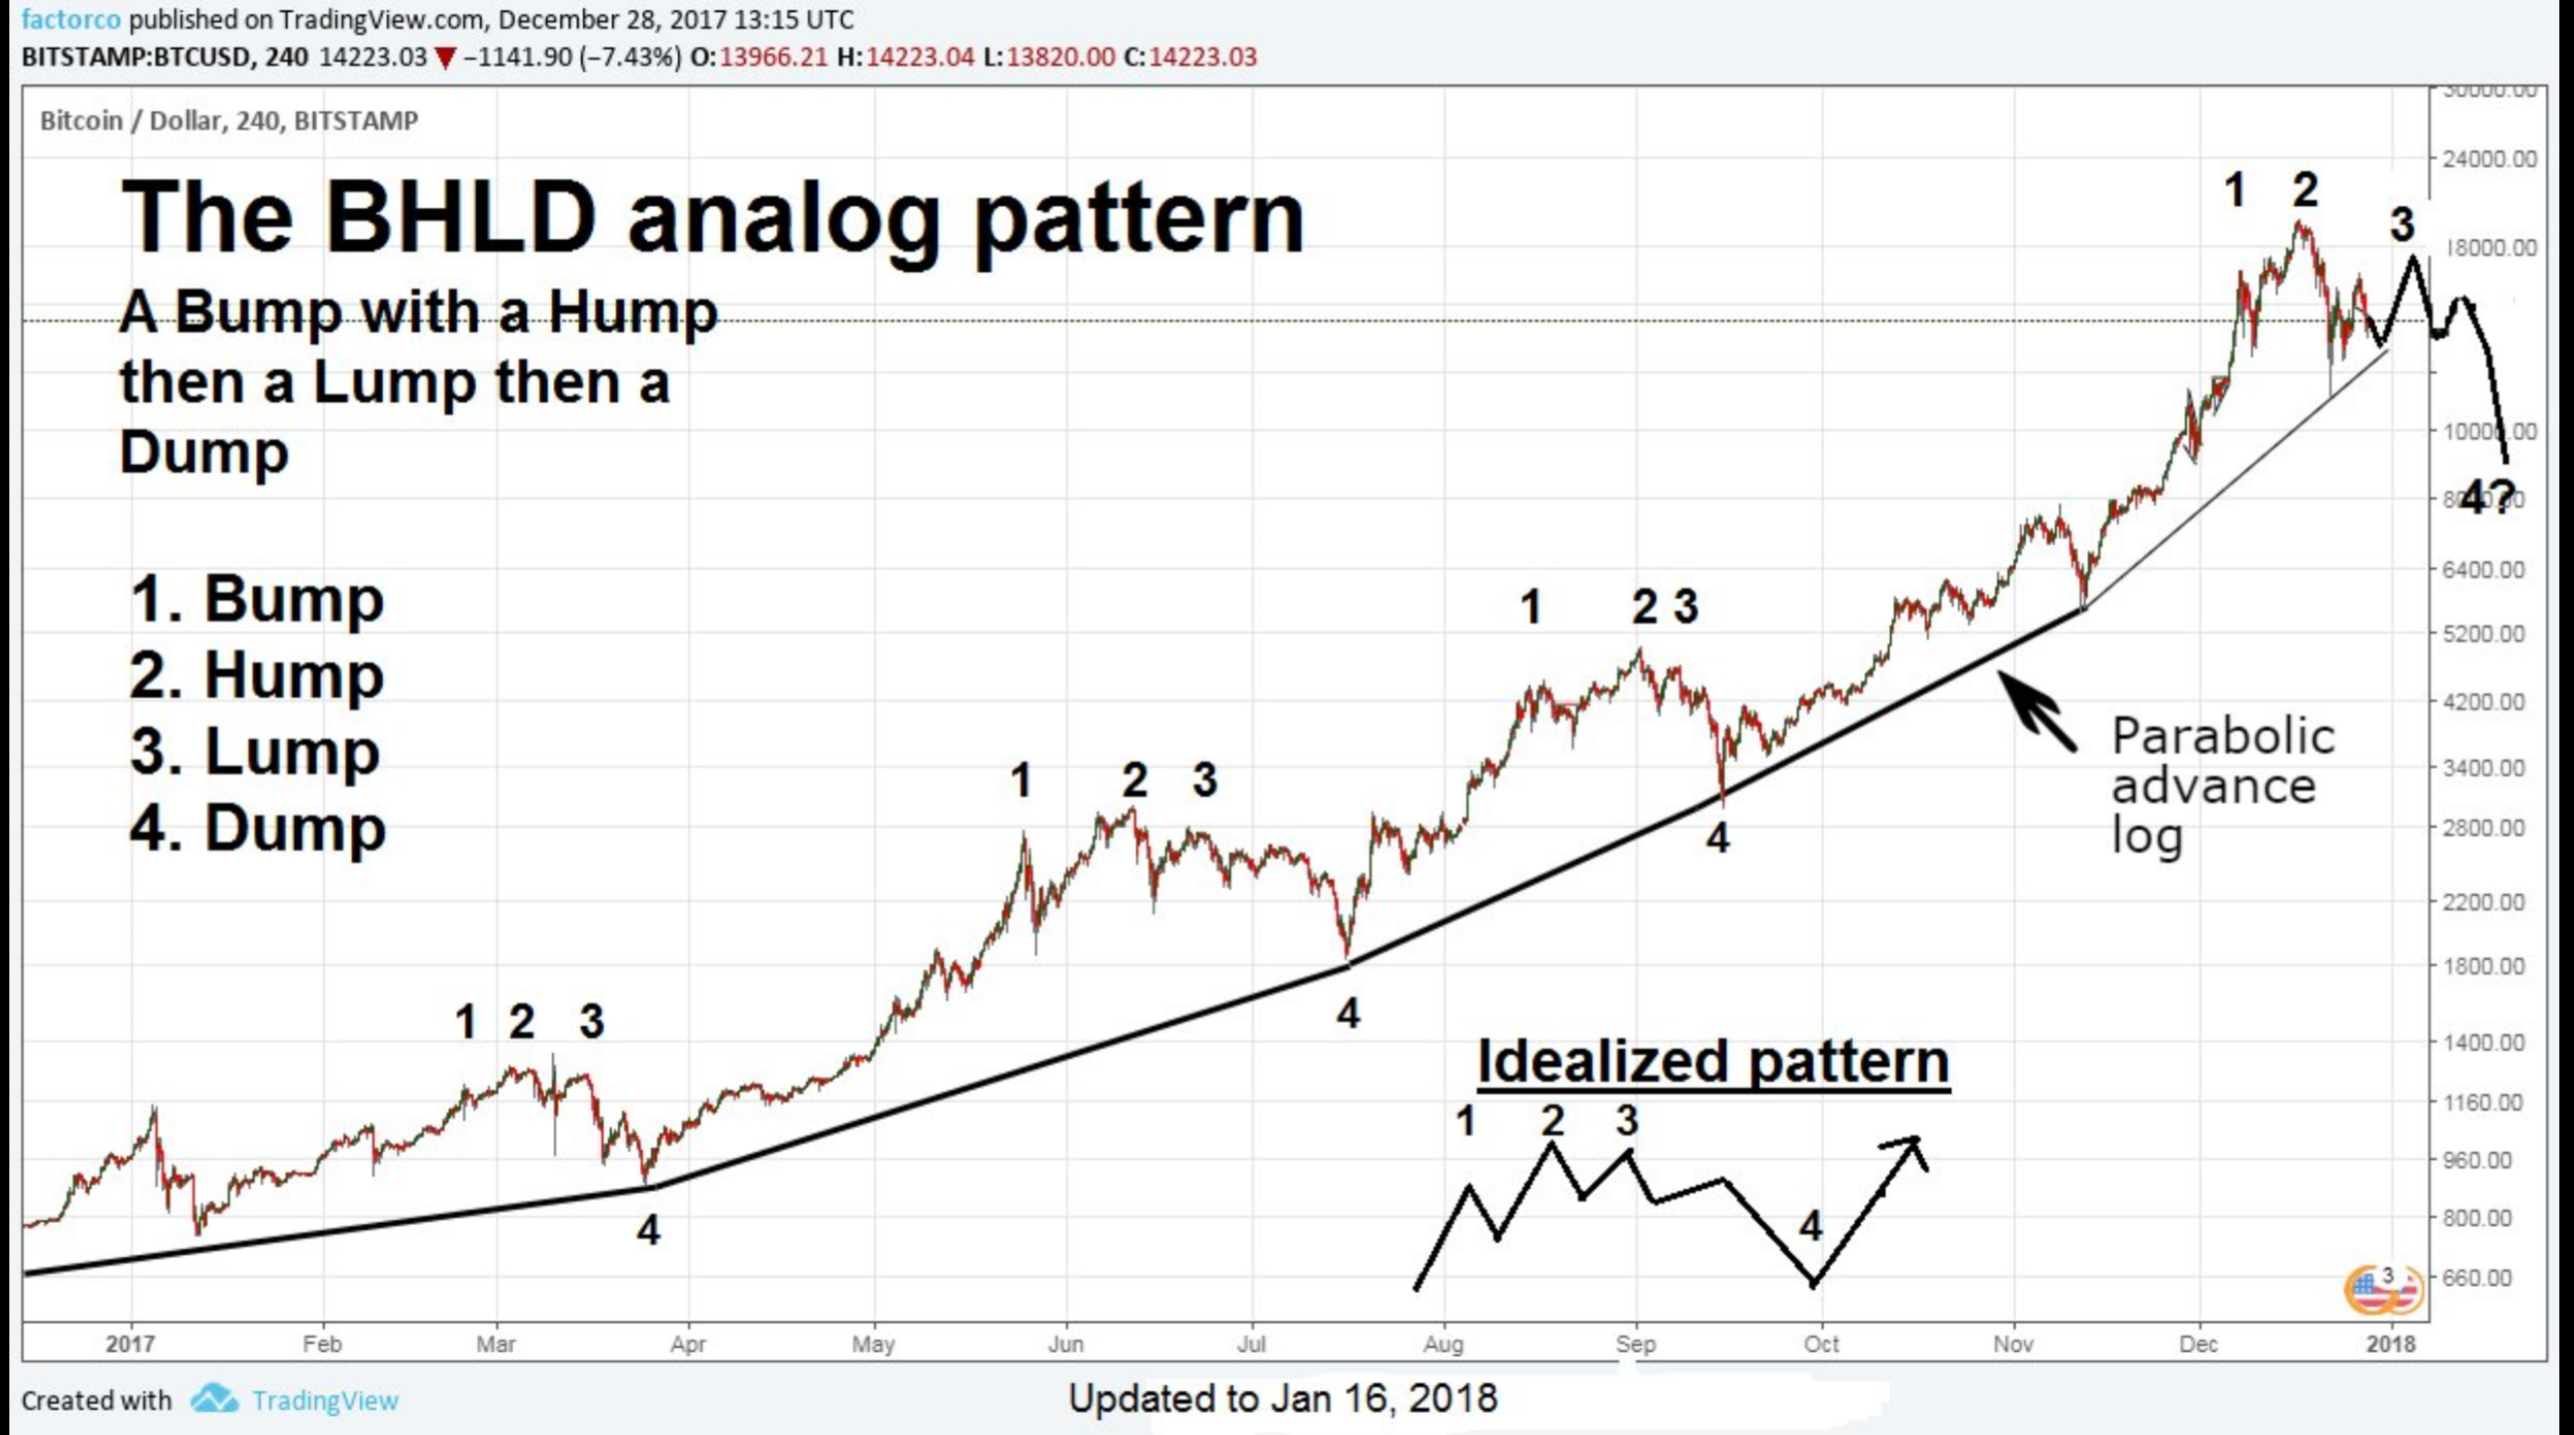
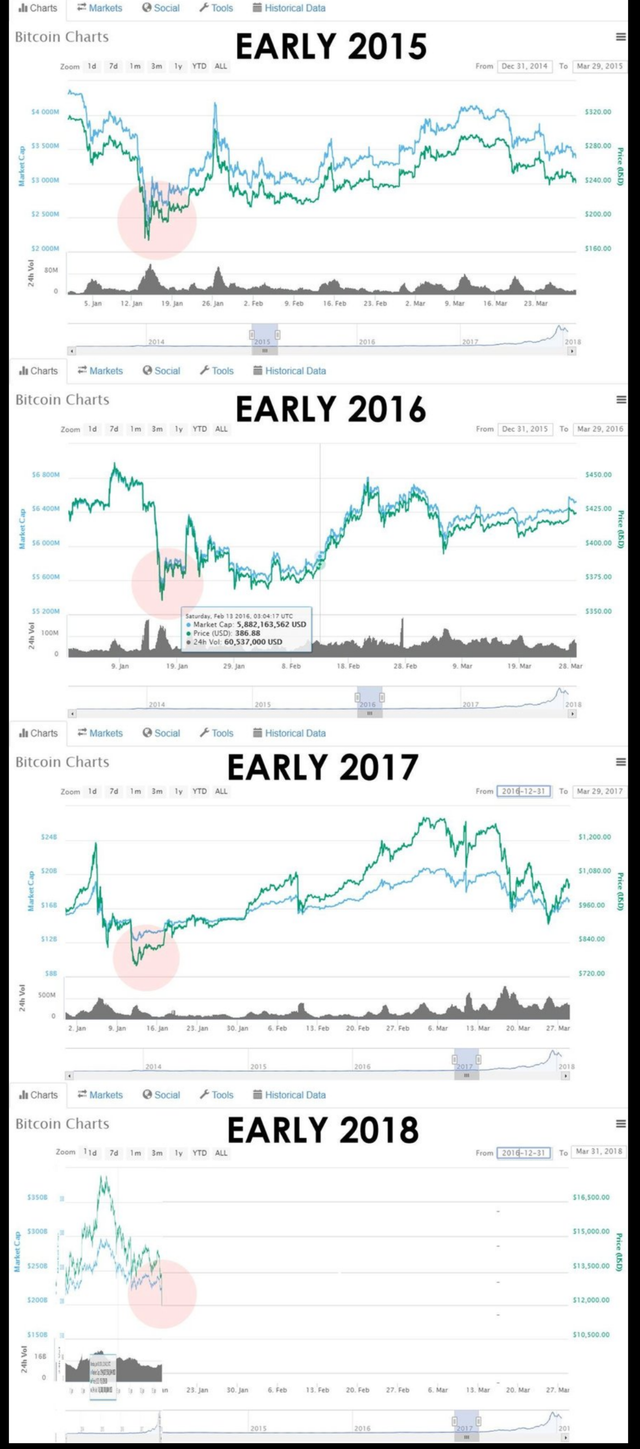
Awesome Chart of History Repeating Itself...Look at the Bitcoin Charts from Past Years that Match this Year!
This is great chart that shows the cycles from years past and how this pattern we are going through is not unusual. Take special note that we will have several, often 3, runs up before the final drop and recovery. Remember to be ready for that pattern should it happen again.
Also according to William O'Neil, a very successful investor and founder of the paper "Investors Business Daily", he has done a massive amount of research on technical analysis, and he has found that some of the most dramatic runs up happen during a bear market. Try not to get sucked in, or if you try to trade, be ready for a possible pullback after the first couple runs up/
Good luck with your crypto and remember to only Hodl when we are in a Bull market. Overall market trend is the most important factor. As you can see in this drop, pretty much all crypto drops together, and often rises together.
PS: A friend sent me these charts so I don't know the source.


Good observation
Congratulations @revilo88, you have decided to take the next big step with your first post! The Steem Network Team wishes you a great time among this awesome community.
The proven road to boost your personal success in this amazing Steem Network
Do you already know that awesome content will get great profits by following these simple steps, that have been worked out by experts?