BITCOIN – Weekly Wrap-up - PROOF OF WORK: May 6, 2018


“Proof of Work”
To borrow an appropriate phrase that one may assign to my long standing wave counts, which may be ascertained and reconciled from my Monthly chart down to the weekly and intraday charts as my “proof of work” as it were, I provide you with the following.
In maintaining such discipline and historical “proof of work,” this not only keeps me grounded as an objective analyst as to the accuracy, reliability, and efficacy of my ongoing technical assessments, but it also provides readers and followers of my work a historical and ongoing record of my observations relative to Elliott Wave analysis on the price of BTC.

…Key Statement:
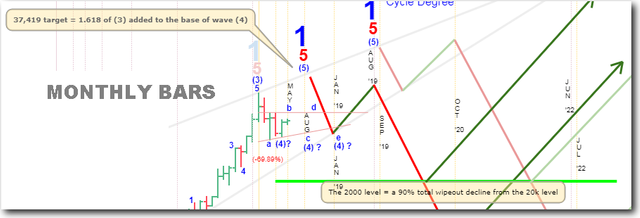
May is a Fibonacci turn-month (+/- one bar), and as such, it appears that May or June could mark a short to an intermediate-term high of sorts in the grander scheme of things. The next Fibonacci turn-month (+/- one bar) occurs in August.
The 50% advance from the April low appears constructive, bullish, and impulsive by every measure.
Be that as it may, there are indeed viable bearish alternate counts that must be taken into consideration despite this recent bullish move higher.
| Short-Term | Bias | Target | Sup-1 | Sup-2 | Res-1 | Res-2 |
|---|---|---|---|---|---|---|
| 4-Hour Chart | Bearish | 8,816 | 9,090 | 8,366 | 10,234 | 10,925 |
| Medium-Term | Bias | Sup-1 | Sup-2 | Res-1 | Res-2 |
|---|---|---|---|---|---|
| Daily Chart | Bullish | 8,816 | 7,675 | 9,949 | 11,688 |
| Long-Term | Position Bias | Date | Price |
|---|---|---|---|
| Weekly Chart | Long | 4-23-2018 | 8,781 |
| SECULAR | Bias | Low 2018 | Target 2018 |
|---|---|---|---|
| Monthly Chart | Bearish | 5,920? | 12,235 min / 37,419 max |
…Weekend Update & Review
Right Click and open in new tab to view full size image.
…Video Update
Select HD and “Full-Screen” for the utmost clarity in viewing this video update.
I trust that the preceding analysis was generally objective, explicitly actionable and informative, and of relative and meaningful value for all those who perceive such analysis as a backstop to their individual ends.
Until next time,
Peace, Love, and Justice for All
DISCLAIMER: This post and all of the analysis contained herein serves general information purposes only. I am not a registered financial adviser. The material in this post does not constitute any trading or investment advice whatsoever. The trend-following strategies explained herein are for example only, and should not be construed as trading or investment advice in any way. The same thing goes for anyone subscribing to the Long-Term Trend Monitor. The subscription simply shares with subscribers what several automated trend-following systems are doing, and that’s all. The bullish and bearish alerts provided therein are for information purposes only, and they are not to be construed as advice to buy or sell. At the time of this writing, the author holds a small position in BITCOIN and several other cryptocurrencies. Please conduct your own due diligence, and seek counsel from an accredited financial advisor before making any trading or investment decisions. Should you decide to mirror or copy any investment or trading examples from this or any other related source, the decision to do so is entirely your own - as are the inherent risks involved in doing so. I am not responsible for any of your losses. By reading this post, you acknowledge and accept to never hold me accountable for any financial losses. Thank you.
Nice work man!
Are you doing Steem too or just BTC?
Also, where do you see BTC by the end of this year?
Just doing BTC... Thanks, @soykatonline... :-)
Love Your TA as always. I see your bull count, but assuming the monthly bear count continues what is your bear count?
The mildest bear market scenario keeps us trading sideways into 2019 prior to basing the (4) wave down. More bearish alternates can be viewed clearly on the daily chart (see video). In such a case the top is in at 20k and a subsequent move down toward the 2k level would be likely in due course. Thanks for your comment and question.
Wow! Thanks man! I've been expecting BTC to fall toward the "log infinity trend line" (for lack of a better word) (would but the trend line at 3570 below today) and I expect it to tag it on the way down and imagine it will provide support just like it did from 8/24/15 to 4/25/17. That said its certainly not set in stone, but I could see it being certainly important. But i'd be curious about your thoughts about it. (cluster of blue lines, sorry about the clutter I've been in crypto since 2013 but am mostly self taught and been actively trading for a year or so), now thinking of throwing some serious (for me) money in the next 6 months or so (probably after stocks fall but we'll see)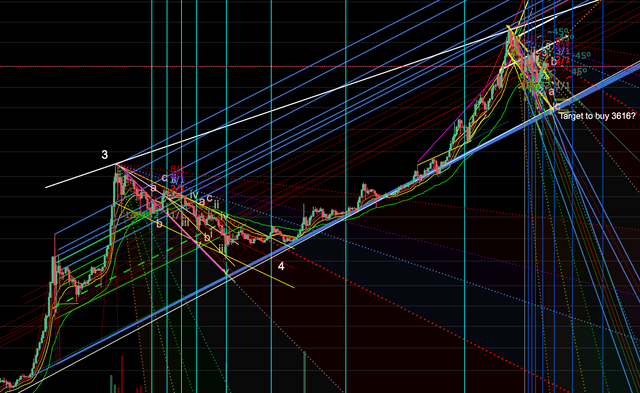
No doubt that's an important trend line. Yes, your chart is cluttered and virtually unreadable... The last time this line was touched on a monthly log chart was March of 2017. As time moves forward, the estimated touch down upon it moves higher and higher to somewhere north of 7k in the 2019 time frame. I hope that helps. Thanks for the comment and question.