You are viewing a single comment's thread from:
RE: BITCOIN – Weekly Wrap-up - PROOF OF WORK: May 6, 2018
Love Your TA as always. I see your bull count, but assuming the monthly bear count continues what is your bear count?
Love Your TA as always. I see your bull count, but assuming the monthly bear count continues what is your bear count?
The mildest bear market scenario keeps us trading sideways into 2019 prior to basing the (4) wave down. More bearish alternates can be viewed clearly on the daily chart (see video). In such a case the top is in at 20k and a subsequent move down toward the 2k level would be likely in due course. Thanks for your comment and question.
Wow! Thanks man! I've been expecting BTC to fall toward the "log infinity trend line" (for lack of a better word) (would but the trend line at 3570 below today) and I expect it to tag it on the way down and imagine it will provide support just like it did from 8/24/15 to 4/25/17. That said its certainly not set in stone, but I could see it being certainly important. But i'd be curious about your thoughts about it. (cluster of blue lines, sorry about the clutter I've been in crypto since 2013 but am mostly self taught and been actively trading for a year or so), now thinking of throwing some serious (for me) money in the next 6 months or so (probably after stocks fall but we'll see)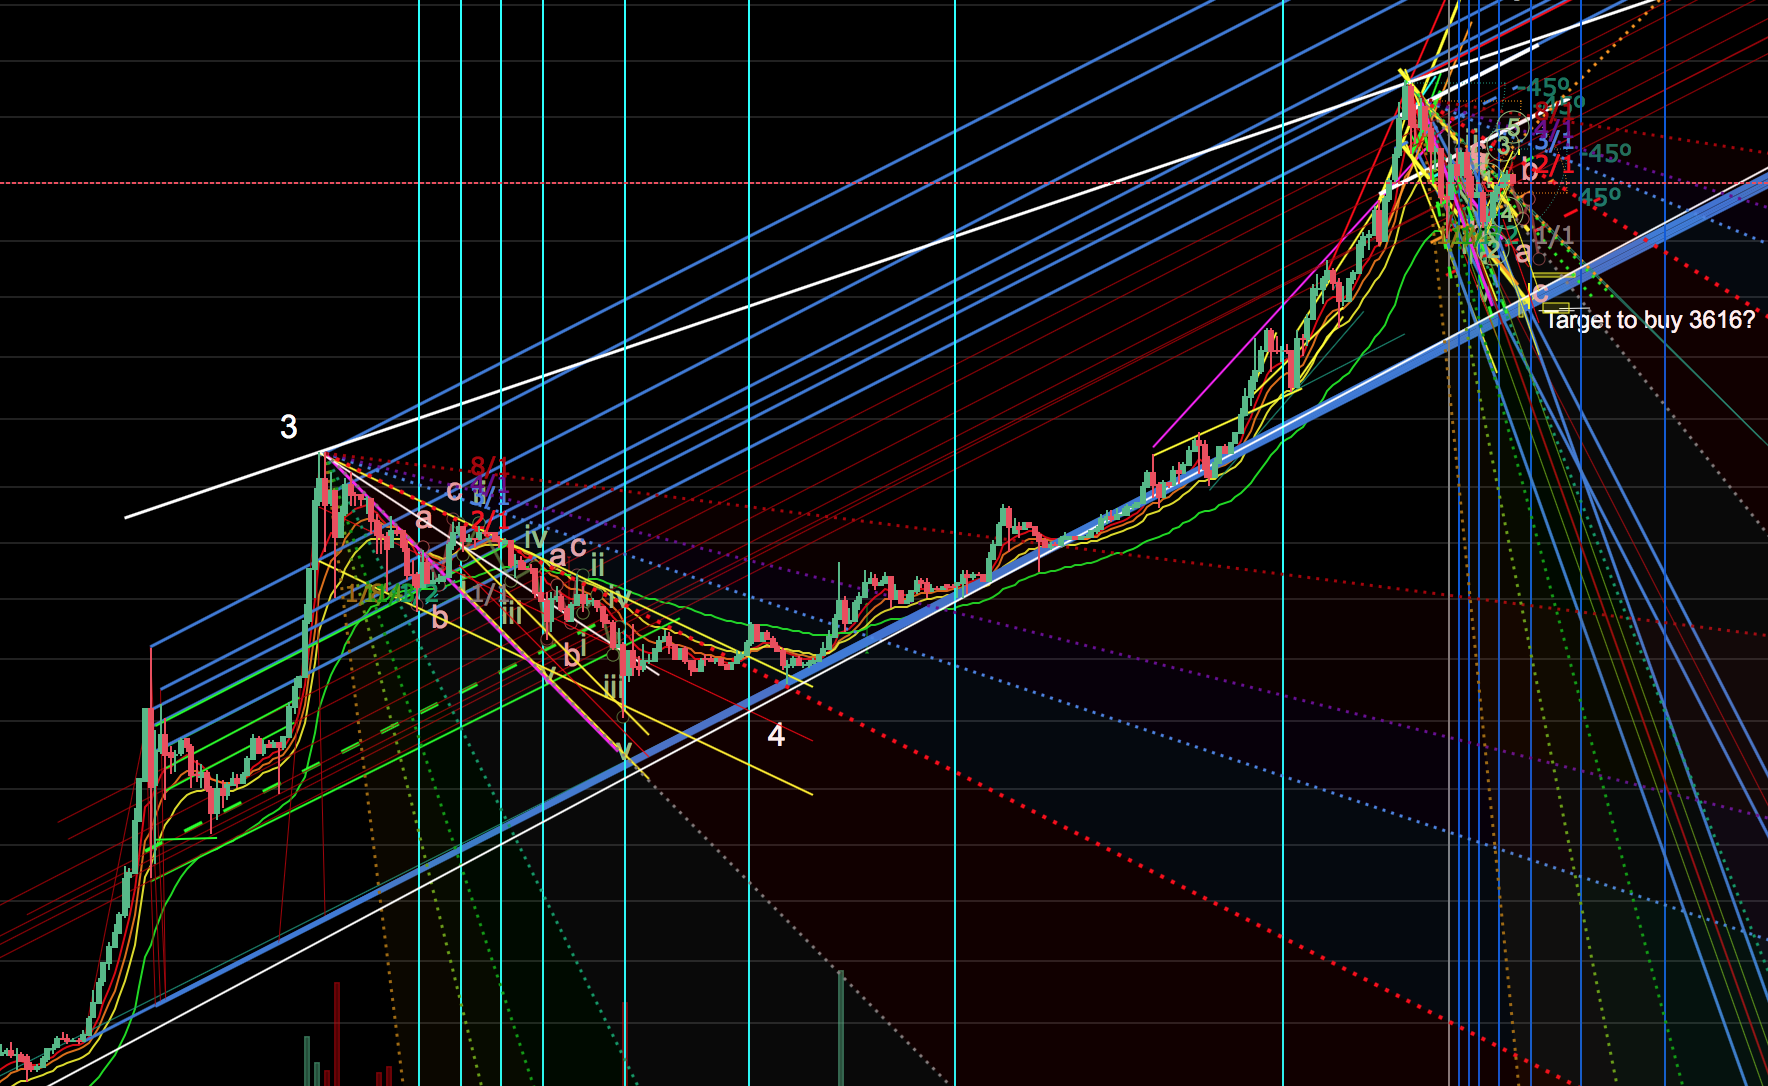
No doubt that's an important trend line. Yes, your chart is cluttered and virtually unreadable... The last time this line was touched on a monthly log chart was March of 2017. As time moves forward, the estimated touch down upon it moves higher and higher to somewhere north of 7k in the 2019 time frame. I hope that helps. Thanks for the comment and question.