A Pathway to $66,000 BTC by July of 2018 (for my friend @ew-and-patterns)
WTF! @passion-ground?
I totally agree!
This all came about when I was checking my feed, something I do not do nearly as often as I should. I’m just way too committed and focused upon the Open-Mic and Songwriters projects… My apologies to all those whom I otherwise “follow” in my "feed" to which I should keep better tabs on.…
As a quick aside, another person that was instrumental in encouraging me to pen such an “off-the-wall” post was @krystle! In a very recent Songwriters meeting on discord, I was joking with the team that I was merely a “one-trick-pony” compared to the multitude of various ongoing projects that @luzcpher, @meno, and @krystle have immersed themselves in. So that in concert with the kind request from @ew-and-patterns is what truly inspired the decision to pen such an otherwise bizarre post - completely out of left field - for me, anyway.
Anyway, I happened to stumble across this high-value post from a respected Steemit author, @ew-and-patterns. It had to do with the current major downdraft in the price of Bitcoin (BTC).
Within his quite successful “triple-digit-reward-post,” this highly revered author, with quite the obvious following - referred to a form of price analysis called “Elliott Wave Theory” in his post.
Click Play to view this very short 2-minute video directly below for a quick overview of this most profound and historically fascinating "theory" of tracking price fluctuations across all time-frames.
Since my alter-ego – or former self (as it were) had been heavily immersed in the practical application of “Elliott Wave Theory” for more than 20-years, I could not help but pose a simple question in the comment section beneath @ew-and-patterns most intriguing and rather successful post.
Well, one comment and reply led to the next, and before you knew it, @ew-and-patterns voted my comment right to the top of the heap! If you wish, you can view this post and the entirety our rather civil discourse throughout the comment thread here:
https://steemit.com/btc/@ew-and-patterns/btc-update-23-01-18-pointing-out-the-worst-case
This seemingly odd post of mine is predominantly intended for @ew-and-patterns and his audience – along of course, with anyone else who may have a remote interest in technical analysis and price forecasting.
As an interesting aside, I know of another popular musician on Open-Mic, @stanhopeofficial, who has recently published a book on Amazon with regard to trading and investing in crypto’s and such. Cool, another musician who is into financial markets – NICE!
Anyway, for those of you who know me exclusively from the Open-Mic venue and the Songwriters Challenge, this post will be quite revealing in that it shows a sort of "alter-ego" of mine that is in stark contrast to, and well, miles apart from the realm of music that I so lovingly immerse myself in here on Steemit.
READY? …So, here goes nuthin’, HA!
So to begin with, amid our quite pleasant exchange, @ew-and-patterns asked if I could please render him an analysis and forward-looking-guidance using arithmetic vs. log scale and to please share it with him if I was so inclined.
This post is a basic response to that request, although, I’m afraid that I’m going to disappoint him in that I simply could not work efficiently with the “arithmetic scale” using 4-hour price bars, however, I did provide the next best thing I could muster. I’ll explain all of the above shortly.
What I did render, which you’ll see further down in this post, is a daily chart replete with all of my off-the-cuff wave analysis and price projections going forward.
Before we get into all that though, I just thought it fitting that I first unveil a small slice of my “alter-ego’s” past as it were. Do bear in mind that I have since retired, and have mostly left the daily life of rigorous market analysis behind me. Instead, I now focus my most positive energy, and devote the bulk of my time and efforts to the Open-Mic and Songwriters Projects here on Steemit.
If one wishes to see the 240 articles I’ve authored on the financial markets from 2006 thru 2016, they can do so with relative ease. I suspect that this will provide adequate “social proof” that I’ve been around the block several times and yes, I’ve built a respectable audience for my analytical work and technical analysis over the course of those 10-years.
10 years of authorship at Safe-Haven from 2006 – 2016
http://safehaven.com/author/246/joseph-russo
Now, as to the reason why I’m disappointing @ew-and-patterns with respect to my inability to accurately work with 4-hour price bars rendered in arithmetic scale, I will simply refer him to an article that I penned regarding such back in 2006.
In a nutshell @ew-and-patterns, BTC simply lacks the several decades of historical price data that would otherwise lend itself to working most effectively within the confines of such scaling attributes and data-point intervals.
Here are some brief snippets from that 2006 article along with a link to the entire article in case anyone wishes to read it in its entirety.
Log Scale vs. Arithmetic Scale
Value is clearly a subjective perception. General investment postures (long, short, or flat) are contingent upon a (assumed accurate) perception that future values will continue to rise, go nowhere, or fall.
That said - price charts are essential in monitoring the present and historical nature in which the marketplace collectively perceives value. In this vein, it is critical to be aware of how the chart data under observation has been scaled. This is especially critical when studying longer-term price series. In many instances, the difference between arithmetic, and log scaled data will have profound effect on the general historical perceptions portrayed by the series.
As such, we can view price data in either arithmetic or log scale. The arithmetic scale measures the progressions from the lowest data point on a chart to the highest in equal increments.
In contrast, the log scale measures the lowest to highest data points in percentage terms. To attain the broadest perspective of past and current price behavior, both studies are essential to observe.
One may read the entire article from November 2006, here:
http://safehaven.com/article/6308/scaling-perceptions-amid-the-global-equity-boom
More Revelations about @passion-ground!
Who is this guy, anyway?
My website, which is still up-and-running (since 2003) and continues to serve long-time loyal subscribers, - can be viewed here: http://www.elliottwavetechnology.com/
Yes, in the event anyone may be interested, subscriptions are still available for long-term investors here http://guardian-revere-trend-monitor.blogspot.com/p/long-term-market-timing-alerts-sent.html, and for short-term traders, here: http://chartcastpilot.elliottwavetechnology.com/
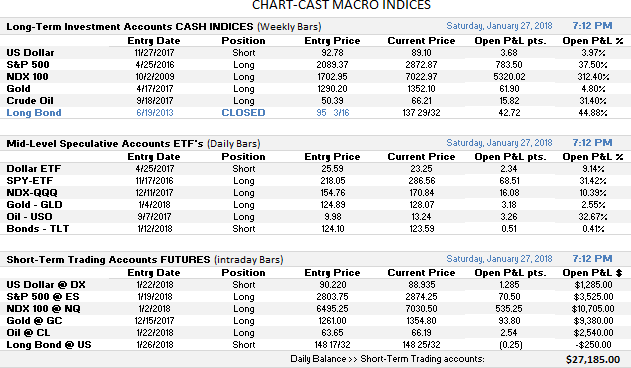
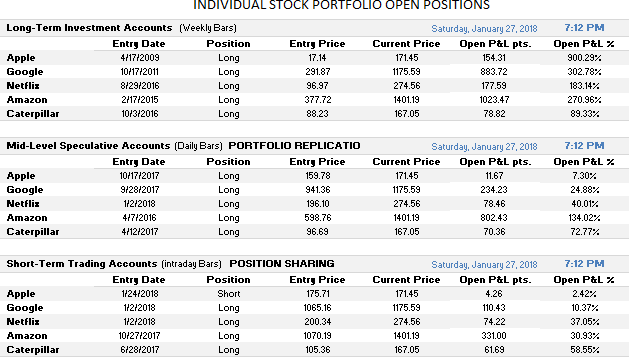
Mind you, the subscriptions showcased above have been pared down considerably from the early years in terms of the technical detail provided therein. The two packages more-or-less reflect the portfolio positions of custom trading strategies that I’ve programmed into the TradeStation platform years ago. Over the years and on balance, these strategies have been quite profitable by any standard measure.
It takes me about an hour each day to update 33-charts illustrating the portfolios current positions (long or short) in all three (short-term, medium-term, and long-term) times-frames across an array of major indices along with a handful of select individual stocks, mostly FANG's i.e Facebook, Amazon, Netflix, and Google type stocks.
Okay, so now that you know who I was then, and still am today to some small extent, let’s get on with the business of rendering that daily chart for @ew-and-patterns, shall we?
Although “Price” can easily be “Manipulated”
“The Charts themselves,” Never Lie!
So let me first set the stage with the initial off-the-cuff Long-term monthly chart of BTC that I rendered in log scale for @ew-and-patterns along with the detailed albeit “shooting-from-the-hip” analysis that I left in his comment thread.
What my quick interpretation reveals using ALL of the available price data provided, are prospects for a large first-wave, perhaps one of “Cycle-Degree” (largest blue “1” wave) to either still be in progress – or having ended already with the recent all-time highs, which I currently have labeled on this chart as a (3) wave (the smallest blue mark-ups).
I am showing this larger FIRST-WAVE up, subdividing into five impulsive primary waves labeled with the large red numerals. With such a view, the primary 3-wave (red) is subdivided into five waves at intermediate degree labeled in the smaller blue markers as intermediate degree waves (1), (2), (3), (4), and (5). As such, the primary wave 3 lasted roughly 2-years, roughly between 2012 and 2014.
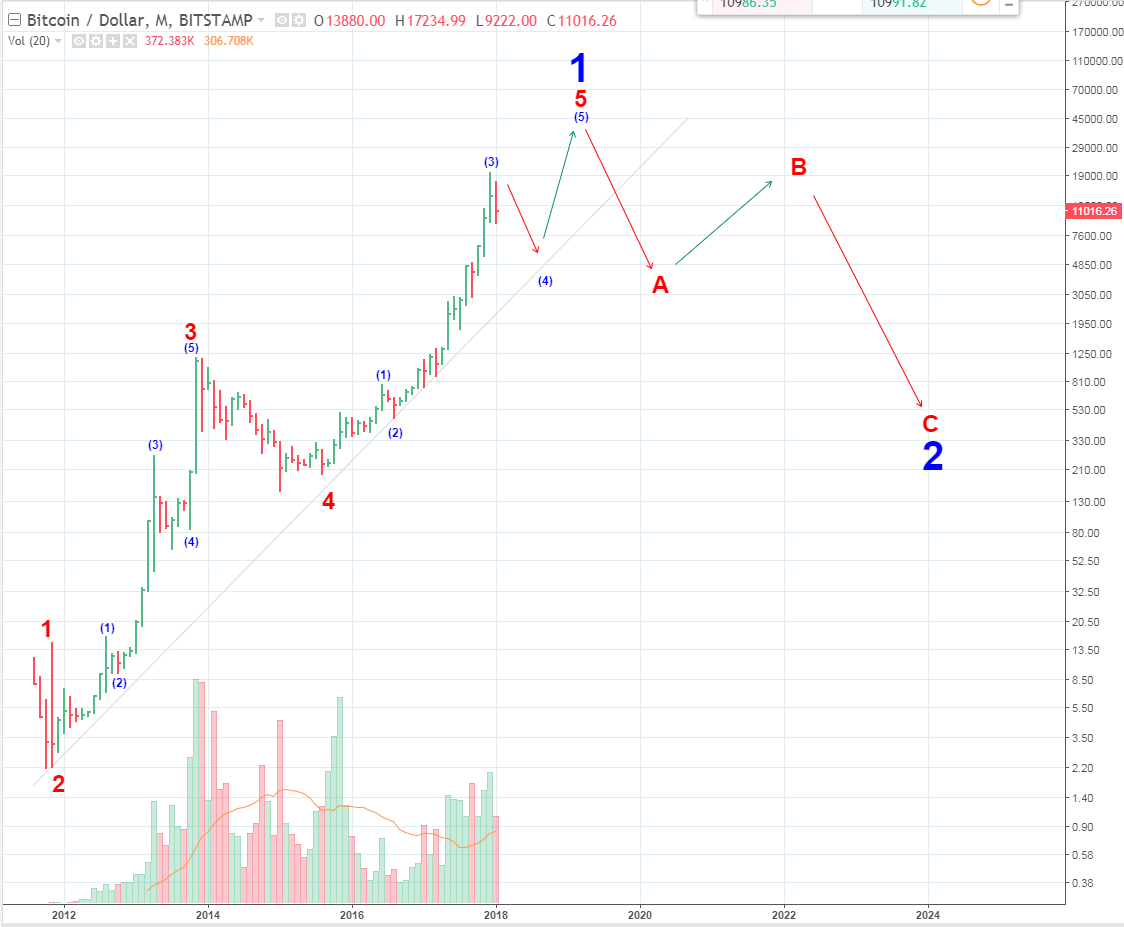
As my count stands here, the primary degree 4th wave decline lasted nearly 2-years as well. It was a sideways affair with a downside bias, as most 4th waves tend to be. This primary 4th wave down ended in the $200 vicinity.
Thereafter, taking us right up to the present, I am showing a powerful extended 5th wave at primary degree (red), subdividing in the five smaller intermediate waves noted.
Insofar as this rather quick study goes, from the recent all-time-high in the 20k vicinity, we may currently be in the midst of an intermediate (4) wave decline (small blue labels), which would then suggest one last push higher is needed to complete the primary degree 5th wave of the yet larger Cycle-Degree 1 wave. Once the current (4) wave decline is complete, this count is EXTREMELY BULLISH over the near-to-intermediate term.
Alternately, and more bearishly, the recent all-time-high may well have marked the end of the large blue first wave up at Cycle Dimension, suggesting that a larger Cycle-Degree wave 2 down may already be underway.
Holding to the tenets that 2nd waves typically decline to the area of the 4th wave at one lesser degree, would suggest that a wave 2 decline at Cycle Dimension, may fall as low as the $200 handle. I’ve outlined such a prospective price path forward into the future using a rough A, B, C, zig-zag decline pattern, which could take many years to unfold – perhaps out as far as 2024.
Well, you asked for it @ew-and-patterns, and there you have it. I do hope that my quick study for a longer term EW look at BTC was up to snuff and that your audience gathered some benefit and insight from it as well. All the best mate, Cheers!
The DAILY charts, forecast, and...
...THE (plausible) PATH TO $66,000 BTC in 2018
Though it’s difficult to see all of the detail, (both @ew-and-patterns and myself lamented about the lack of a “click to enlarge image” on Steemit) the daily chart below depicts classic tenets of Elliott Wave structures from 2014 to the present.
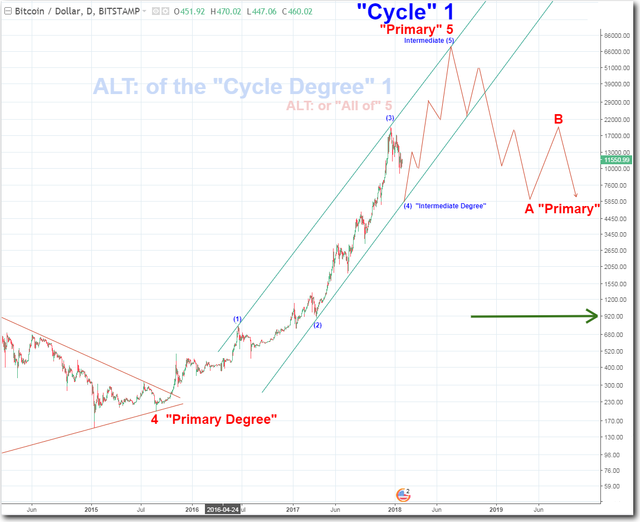
The “preferred” wave count rendered depicts the most recent all-time-high as that of terminating wave (3) of the intermediate degree of trend. This is THE most bullish interpretation over the near to intermediate term.
However, one must recognize that the maximum downside amid the current wave (4) down in such a bullish scenario, has the potential to test the depths of a BTC price as low as $5,850 before the intermediate degree wave (5) of the primary 5th wave of the yet larger fractal of the Cycle Degree wave 1 up gets underway as illustrated.
If such a price path is plausible, which recent history suggests that it most certainly is, BTC can rally in the most incredibly insane way imaginable to heights slightly north of $66,000 USD! Yes, I know, it’s completely unimaginable!
I’ll provide one last “close up” of this very same chart of the price action before bringing this rather bizarre post of mine to a close.
The “close-up” exploded chart below shows the most bullish projected price path capable of launching BTC north of $66,000 USD.
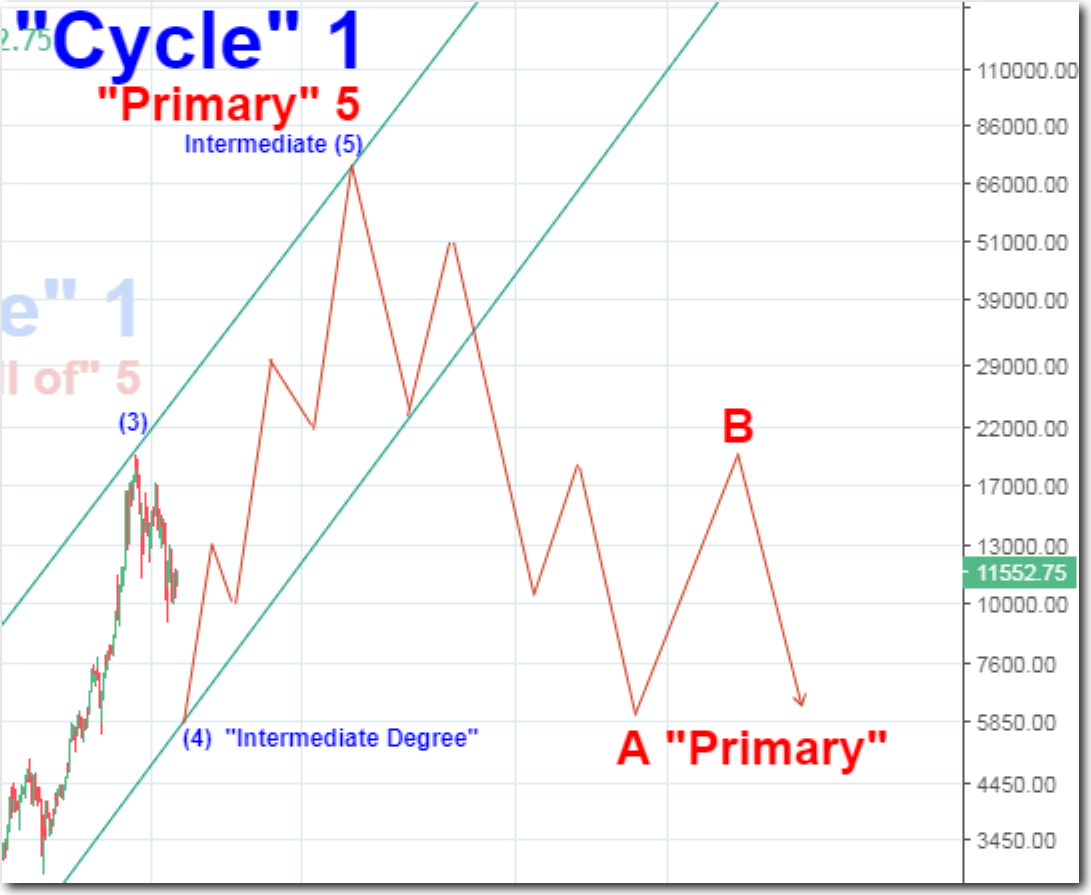
Do bear in mind, however, given the level of volatility inherent herein, that it remains quite plausible that the intermediate wave (4) down currently in progress - could plausibly test log-scale trendline support near the $5850 level before the next and final leg up to the crest of “CYCLE WAVE-1” commences.
I state this because it’s always good to know the worst case downside possibilities even amid a longer-term bullish outlook.
I hate to wrap this up on a bearish note, however, as any qualified Elliott Wave analyst worth his salt would readily admit; there are always “alternate” price paths (or “Wave Counts”) to consider besides the “preferred” forecasts that such qualified technicians may otherwise render in good faith.
That being said, the most bearish alternate interpretation that this quick study may reveal - is that the “CYCLE DEGREE” 1st wave up may well have already terminated at the most recent all-time-highs.
If such a longer-term bearish alternate interpretation were to come to fruition, the first minimal target level for meaningful support for a “CYCLE DEGREE” 2nd wave down to terminate is near the $920 level, which is the bottom of the previous intermediate-term (2) wave amid a classic extended fifth wave advance.
And there you have it, @ew-and-patterns. I hope that you and your audience - as well as select segments of my limited audience, were able to appreciate and gain relative value from this post for what it is.
So, What Do You Think? ...
Tell me...
Do let me know if you guys would like me to continue posting these kinds of “off the beaten trail” posts.
If you do, and you encourage me further, I may continue similar posts along these lines - but it's ALL up to you!
Plus...
I have a post in development, - on the back-burner if you will. – It’s a potential “series” of music-related articles called “The Eight Songs of “Passion.”
So do let me know - as your responses, up-votes, and comments will give me the appropriate measurable guidance as to whether or not I should remain a “one-trick” Open-Mic pony, or if I should indeed branch out to address other areas of knowledge and interest that may possibly add value to the Steemit platform.
(At least, that is - until Season-2 of the Songwriters Challenge gets underway!)
I hope that @ew-and-patterns is satisfied with my response herewith, and from the very bottom of my heart - to all those that this post has any remote or forthright meaning, - thank you!
I am feeling so honored right now! Very flattering of you. Thanks for putting so much effort into one single post.
Do you think that BTC will hit the downside of this channel, or do you think that the fib retracements will provide enough support for this correction. Right now I would label it WXYXZ (Z incoming soon)
This post is very pleasing to me and I like what you came up with. I hope to see some updates in the future (maybe once per month?)
Good luck and have fun with your openmic guys ;-)
Of course I had to resteem this post to my 2335 Followers. Steem on!
With the overwhelmingly positive response, I'm feeling quite honored as well, brother! Thank you for your support and re-steeming this to your great audience! I'll see what I can do insofar as providing some sort of monthly update. Thanks again, man!
I told you so... Glad that I could help.
If you happen to find a rare investment opportunity, be it stocks, indices, commodities or any crypto, feel free to share it. Your and my audience will apprecitate it! Talk soon.
Thanks guys this is great stuff!! A monthly update would be great @passion-ground
Hello Ew thank you for encouraging and bringing passion ground post to our attention. I am still trying to digest it, but 😮 wow. yes Passion do post again. like many here I am newbie when it comes to EW and TA, but try to use the helpful info posted by EW to not get burned or FOMO. Hey EW I noticed Passion Ground did not answer your question. I still have cash and feel paralyzed right now. I hope you guys are right about one more leg down, or man I will really have to suppress FOMO when BTC starts shoooting pass 15k 😮😮😮
I'm working on a little something right now to try and address @ew-and-patterns question. I hope he likes it...
Hey, brother - I just prepared a post that I hope answers your question, and add's a bit more insight using 8-hour bars from my TradeStation platform. Should I link it somewhere in one of your recent comment threads? Let me know what you think is best. Thanks, man!
Great. Just link it under my most recent BTC update post ;-) Thanks.
Following
I am following @ew-and-patterns for quite some time and came to your post through his resteem. I read several analysts regularly - Tone Vays is one of them but I haven't seen an analysis on the long term yet. It answers the questions when will this bull run come to an end and that is something I am thinking about a lot. That said beside the TA it is totally in line with crowd behavior I am experiencing. What I see at the moment is money piling up for a rebuy at a dip. So I feel we will go down to the 5'-7'000 range as you and @ew-and-patterns says. After that a lot of people want to get on the train. Massive rebound bringing as to all time highs which will be insane. After that we get a massive sell off - a lot of people get burned and not touching bitcoin for a long time which would lead to cycle wave 2.
I feel like with your post things come together to a clear picture. Of course - alternate scenarios are possible and fundamentals like regulations could lead to different scenarios but my main scenario is with yours.
Thanks for that precious post. Hope to see more of you in the future.
Thank you for sharing your most astute insights and kind words, friend!
I am just sitting in front of your post with a friend of mine (@knircky) discussing your long term chart. We were wondering about two things:
Thanks for the insightful questions, @famunger.
In answer to your first, though backed by nothing quantifiable beyond where the projected trendline and top of the channel happened to intersect, - that insane projected high north of 66k landed in the vicinity of July of 2018.
As to any prospective Cycle Degree decline in the vicinity of 2024, which is also a non-quantified time-frame, I used two quick downside targets for a plausible wave-2 down of such magnitude. The first is the notoriously common retracement to the 4th wave of one lesser degree, which in this case is the primary red 4-wave in the $200 area. The second such target is in the $920 area, which is another common retracement level target defined by the base of wave (2) amid such an extension.
As to the fundamentals of viability and market cap - I have no clue. For all I know we might have an entirely new financial system by that time. Ya never know...
Maybe with this new "lightening" network on the blockchain or perhaps even with the future introduction of the much-touted superior "hashgraph technology," the financial system (including cyrpto's), in 2024 and beyond - might not look anything at all what it looks like today.
Hope all of that helped somewhat! :-)
Thanks for your response and insights. Does make sense a lot and helped us understanding.
You're full of surprises @passion-ground! Thanks for sharing your knowledge on this topic and I hope you write more about it.
I concur that a correction is on the horizon before bitcoin shoots back up again. I will be buying more during the dip.
Keep up the good work my friend!
Ha! Thank you, brother! :-)
Oh man! This is so amazing to see more about who you are. I would have never guessed following you as an @openmic judge and your musical background. A technical chartist! Go figure. Did not see this one coming.
Thanks, brother! I'm a bit hesitant to reveal too much - but "what the hey" - it is what it is, and I am who I am... thanks again for your comment, man! :-)
Thanks for incuding both the explanation for Elliot Waves, and an analysis and not just one of them (I have seen that too many times).
I also like that you mentioned the need for being able to click to enlarge images on Steemit. It should be an easy job for the developers, so if it reaches their attention, I'm sure we will see an implemented solution soon. In the meantime, It's possible to just right click on any image and copy its link address and paste it in the url bar;)
Or you can Right Click over the image, and after click "Open the image in a new tab", more easy that copy and paste link
Cheers :D
Ah, I totally didn't think of that. That's definitely much easier, although technically the same process;)
This is a brilliant solution to the dilemma of image sizing, friend!
Great information. Its elaborated graphically and written clearly. Good information for the steemians. Thanks for sharing the post.
this was fantastic work Passion.... I would love for you to continue doing these posts, so please do.
Thank you, my musical brother-in-arms!
that looks like some great rollercoaster for the next years to come I'd love to see more scenarios for this, I follow you from now cheers
Hey friend! Not gonna lie, a lot of this stuff goes over my head.. but it is obvious you possess strong interest and knowledge in this area. That said, keep posting! If you take the time to write such a detailed post, you must enjoy sharing this topic.. go for it 👍🏻👍🏻
Thanks for the encouragement, Kay! Perhaps I will take the advice of @ew-and-patterns and provide some sort a monthly update. :-) We'll see...
Yes, I think you should 😊