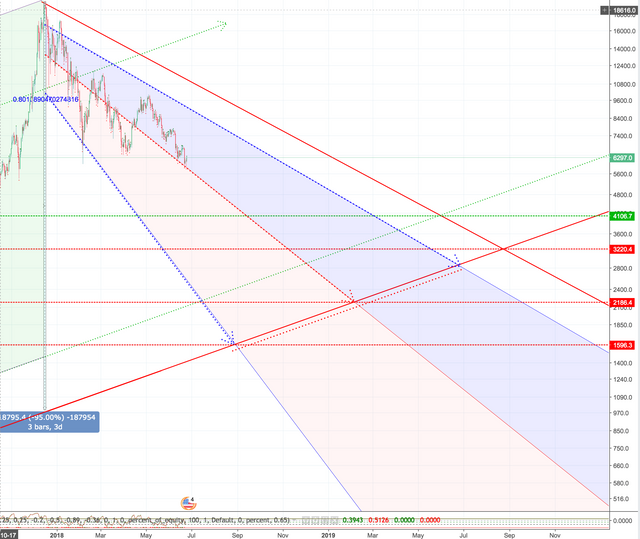
Regression analysis on current BTCUSD downside
The current downtrend is well on it's way, but how low can BTC realistically sink? NO one knows. Here are some very rough guidelines:
The solid upward trending red line is the -95% bottom line counted from the top as well as through the all time earlier bottom. It represents the potential low levels at any given moment from here on. That is, if the underlying long meta trend holds.
The regression analysis suggests by a 80% r-correlation, that the BTC price could fall as low as roughly USD 1600 and still be within this historic growth trend. That is very, very unprobable tho. At least during this downtrend. The expected value by the current rate of downside suggests to me, that the bottom should be between USD 2200 and 3200 but not much lower.
If the price drops below we know, that the current growth trend is not holding.
Finally I consider the downtrend ended once the price breaks away from the upper blue dashed line.
Stay cool :)

Heh.. New to this so I accidentally upwoted this :D Guess not very good practice.
Upvote this: https://steemit.com/free/@bible.com/4qcr2i