BTC chart review, Oct 15th @ 14:45 PST
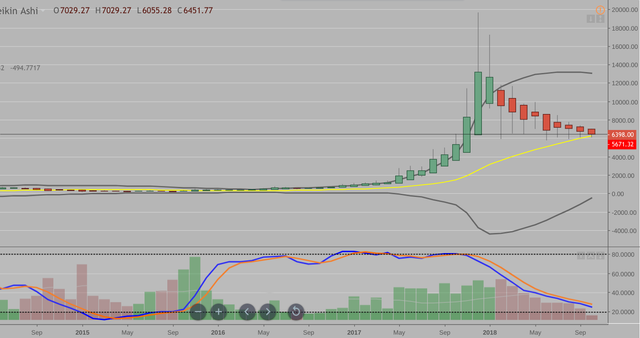
Here is the monthly chart from bitstamp exchange, it has printed a series of red heikin ashi bars illustrating the bearish market since December last year.
The 20 month moving average is the yellow line and appears to be a support level
Stochastics are still heading down, but have been leveling off over the last few months.
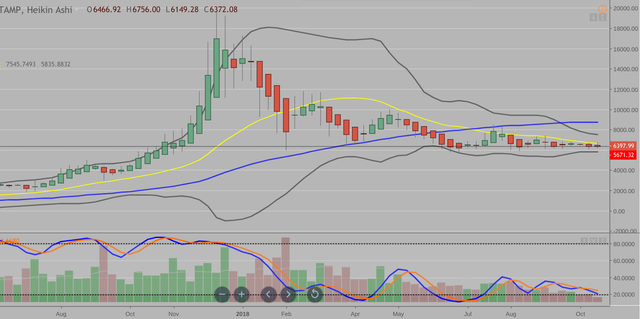
The weekly chart has the 20 week ma in yellow and the 50 wma in blue. The 20 wma appears to be providing a resistance level, price definitely needs to be above the 20 wma to start a bull trend.
The bollinger band is at it's narrowest point in quite a few months. Price will eventually break either up or down at some point.
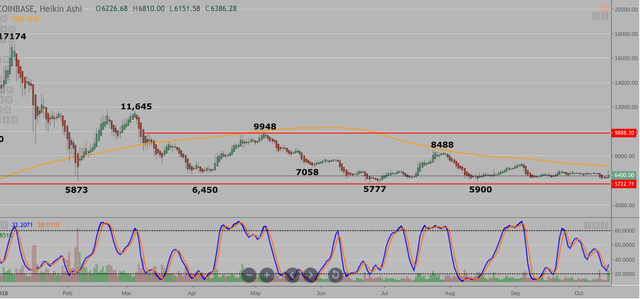
The daily chart has the 200 dma in orange and price will need to trade above this level to start a bullish trend.
You can see the trading range that it has been in this year.
For the bulls, it would be best if price can break above the last major high around 8500, then 9950 which is the upper trend line.
There is only 2.5 more months left in 2018, maybe it will go down as a consolidation year?