REALITY CHECK: Bitcoin HAS NOT Bottomed
It irks me to admit what I think and go against the grain here. It really does, because I am a firm believer in crypto.
Technology advances exponentially. Crypto is moving 10x faster than any other new technology (it is built on technology that moved 10x faster than its' predecessor. But I am seeing issues in the price.
Image courtesy of: https://btcmanager.com/former-cftc-chairman-bitcoin-bubble-will-not-burst-anytime-soon/
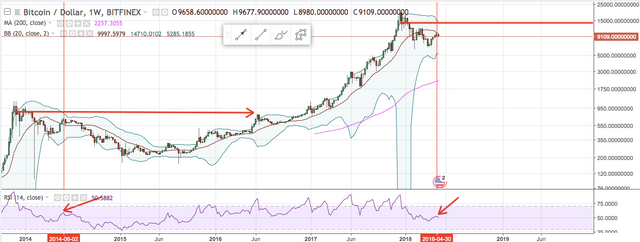
Take a look at the Bitcoin chart below. I am seeing a new pattern develop and bitcoin is just going to take time. I believe we are right where the second arrow is on the indicator at the bottom .I am not saying that this bear is going to take as long as the last one did (2.5-3 years). However, 5 months is hardly a drop in the bucket in a bear market and people are already betting it gets back to 12K easily.
I am going through crypto charts and many of them look like poop. STEEM is breaking down, NEO is breaking down, NANO is breaking down, LTC is breaking down.
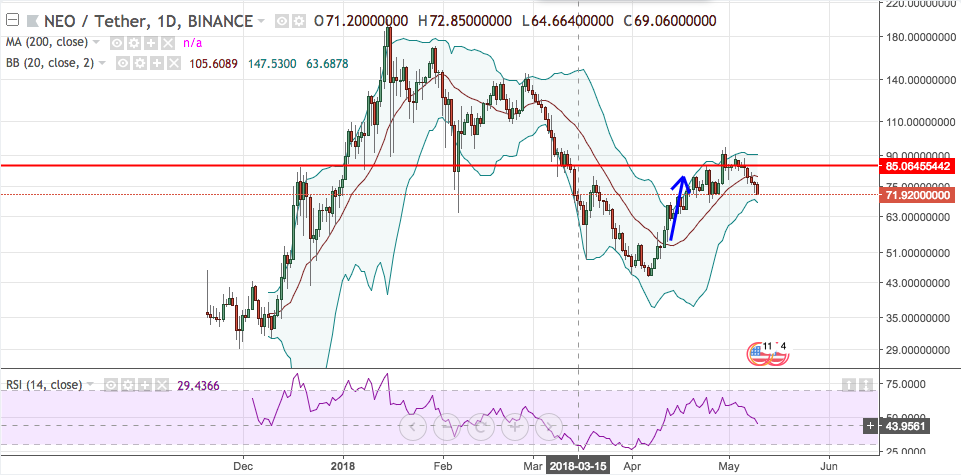
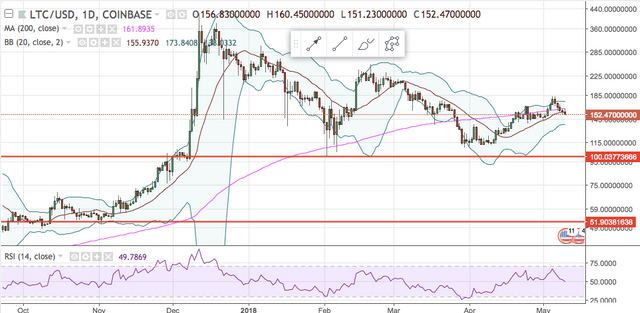
ETH looks the best but I wouldn't rule this out? I mean hell ETH hasn't even HAD a bear market really. I am tlaking a true 80%+ bear market.
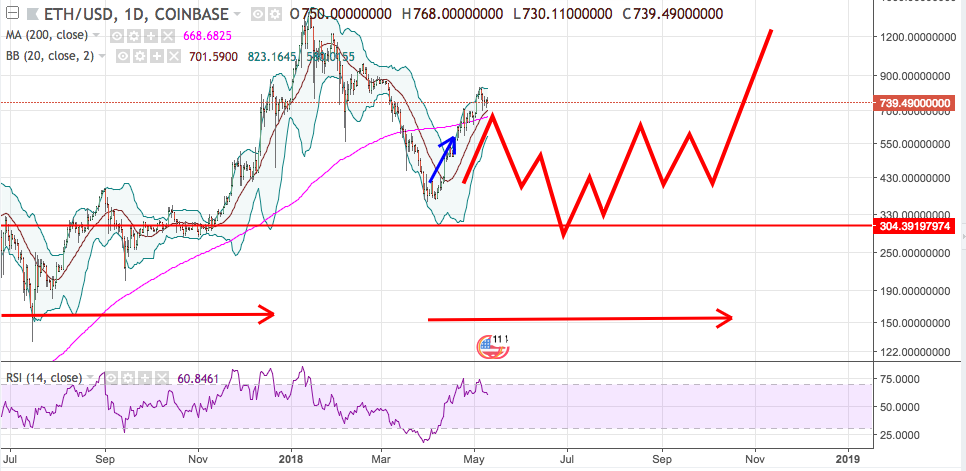
Every new crypto trader needs to through many of their indicators out the window when it comes to a true bear market and the fact of the matter is there has not been ANY panic and all we have is price going no where and a little bit of time. What bubble truly ends without panic? So when people are quoting the kinjin or the cloud or whatever other new bullshit trend indicator they have come up with I would take is with a grain of salt.
Sure that shit worked in 2017...but WTF didn't work???
THE ONLY THING that everyone should worry about is the 200 day Moving Average. Above that and yo should be along for the ride again, Below that just stay away for now and wait (or accumulate for the next bubble).
The 200 Day MA is the pink line on the chart....it rode it all the way up and now it is below...
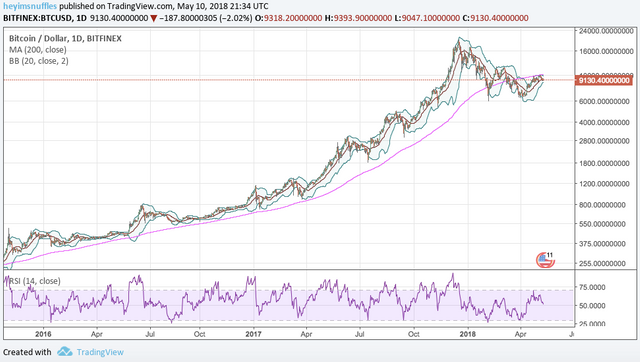
Be BEARISH until it is ABOVE
Excellent..(I do not like the sentiment indicators I watch.)..see DailyFx. ..
This post has received a 9.23% upvote from @aksdwi thanks to: @heyimsnuffles.
You got a 20.62% upvote from @nado.bot courtesy of @heyimsnuffles!
Send at least 0.1 SBD to participate in bid and get upvote of 0%-100% with full voting power.
Nice post ! You got 28.57% upvote from @flymehigh. Earn free sbd/steem daily by delegating(renting) your SP. We share high return, click here to delegate your sp to flymehigh if you don't know, how to earn passive income by delegating your SP click here for more info Join our discord You can promote your posts. Thanks.
This post has received a 100 % upvote from @kath1 thanks to: @heyimsnuffles.
This post got upvoted by @goldenwhale
✔ Upvote Service for Minnows │ 2.5x upvote Return