Burned tokens, rewards, and inflation summary May 20, 2023: 173K SP, 115K STEEM, and 1,146 SBD burned in 53K burnsteem25 posts
Steemit launched the #burnsteem25 initiative on May 22, 2022 and the corresponding rewards started being delivered to @null on May 29. Here is the next weekly update with PowerBI charts to visualize the burned token-related statistics since those dates.
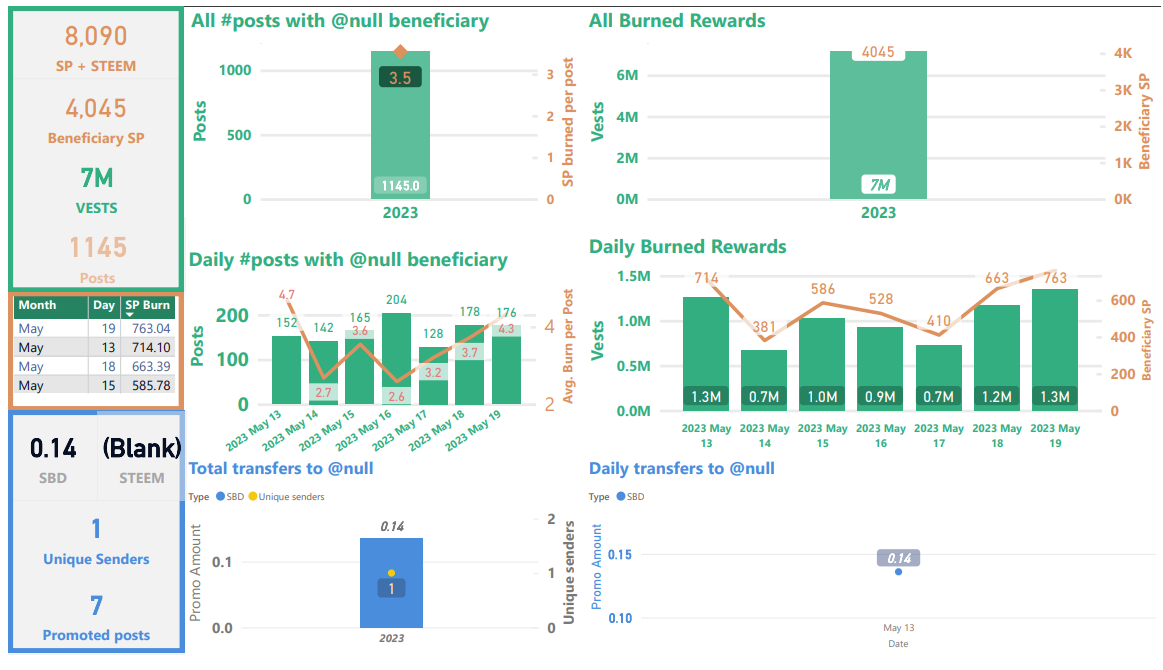
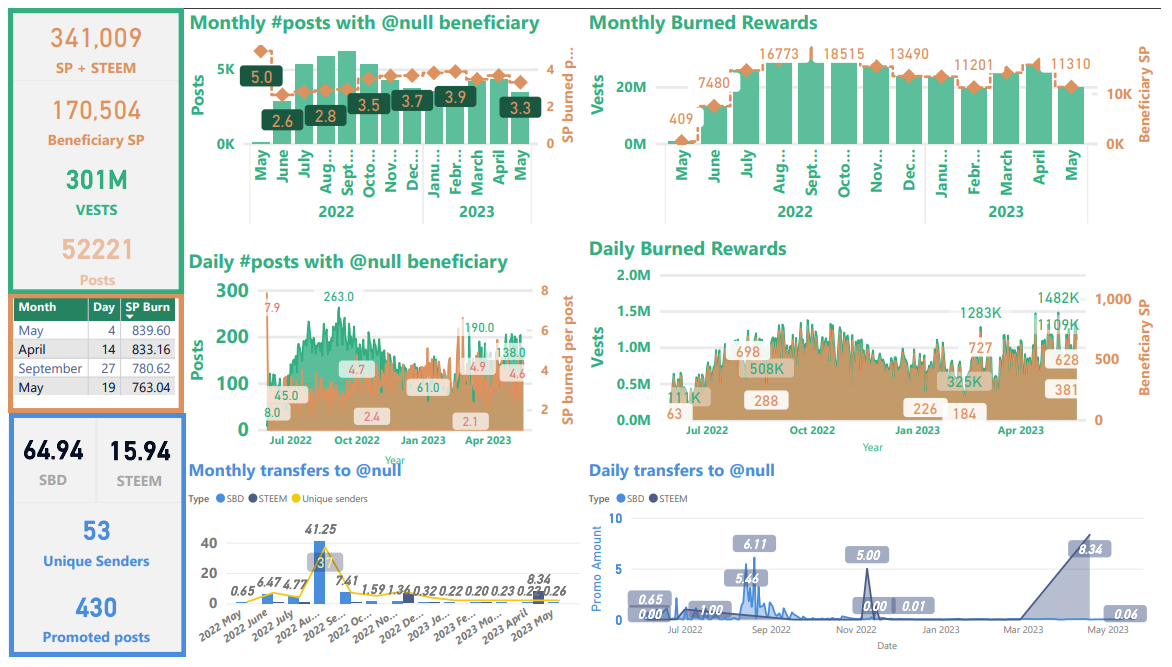
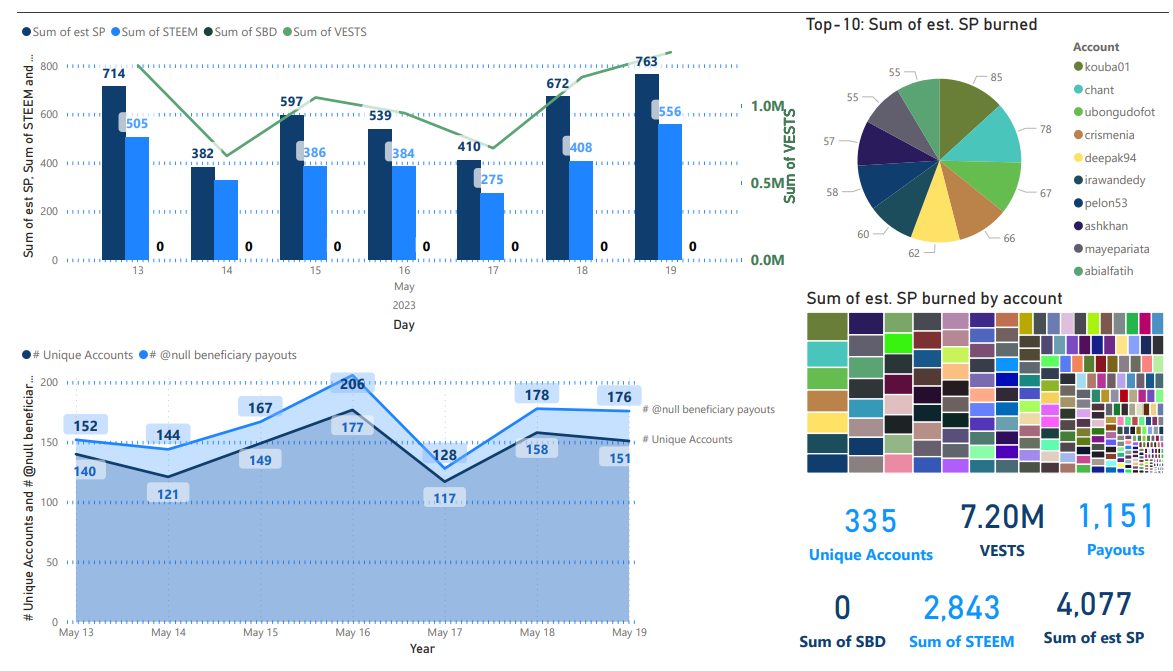
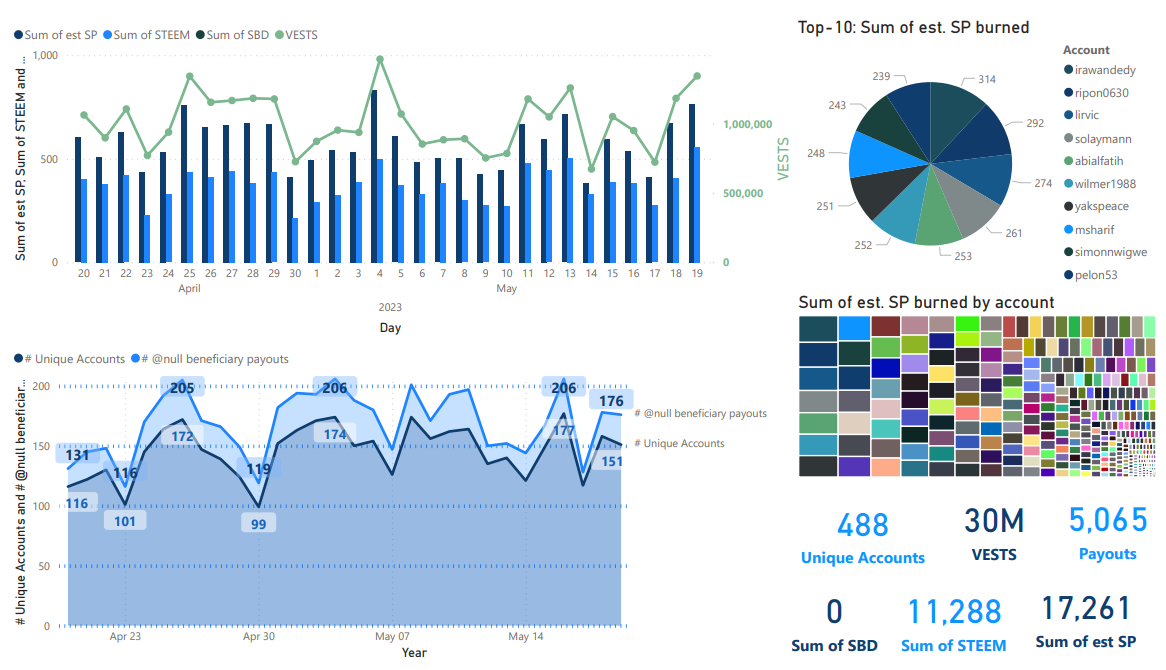
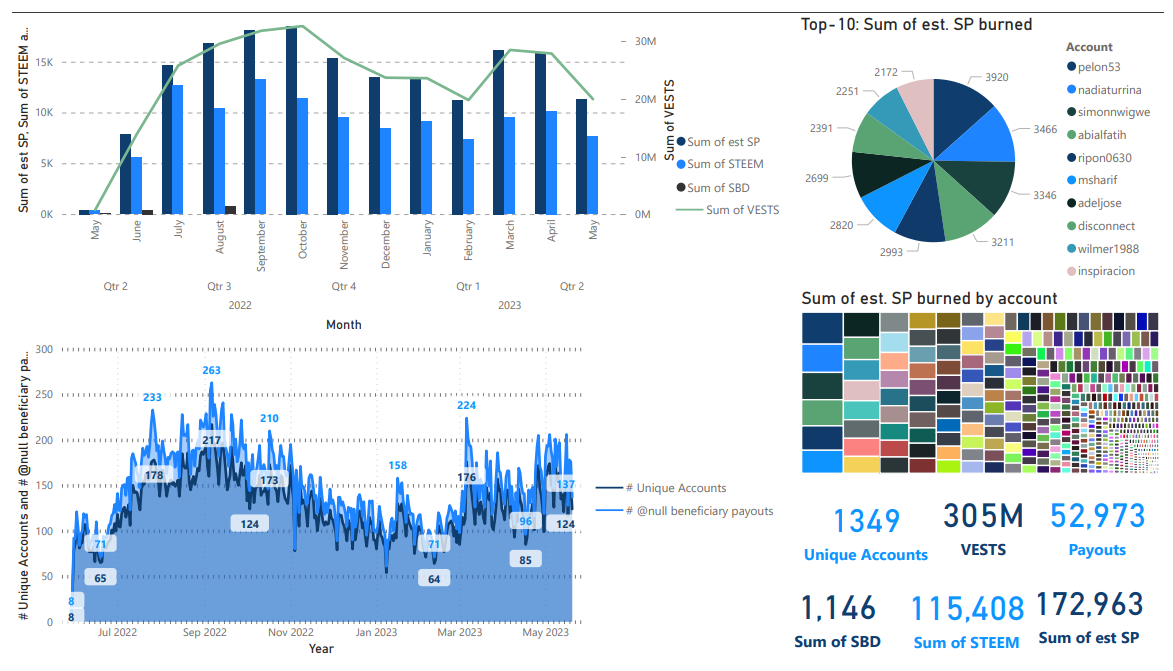
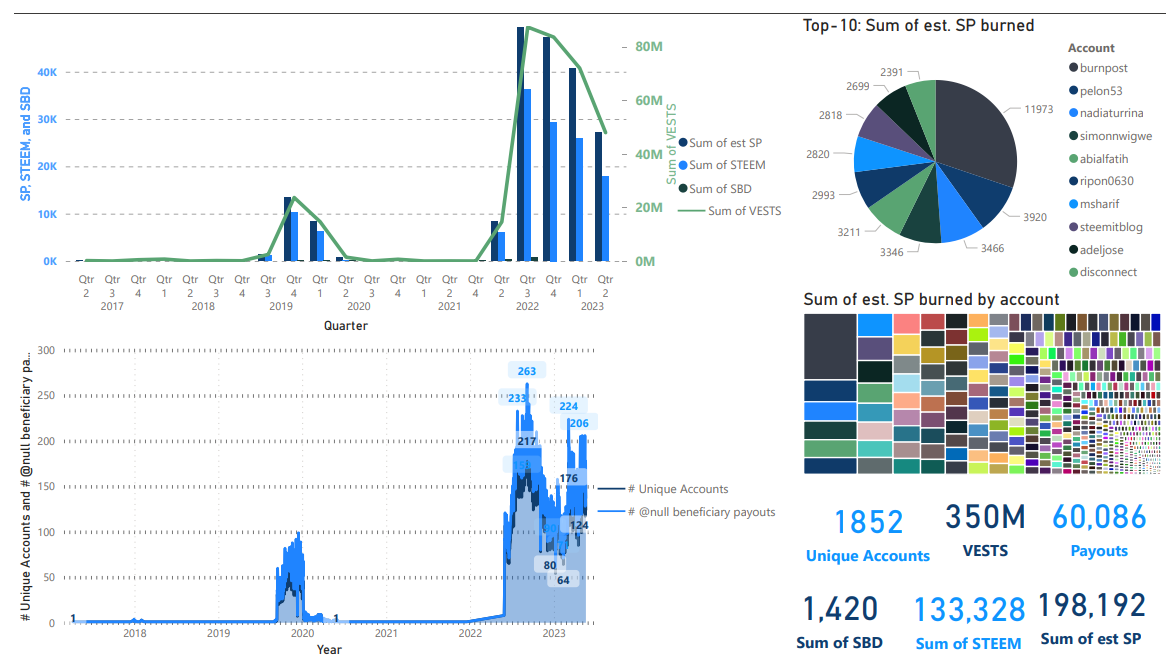
Slide 1 & 2: Burn amounts in beneficiary rewards and transfers to @null. (Weekly & All time)
According to data from steemdb, weekly totals were about 4,045 SP in burned beneficiary rewards and 0.14 SBD burned on promotion with 1,145 burnsteem25 posts (~3.5 SP burned per post).
The numbers in these slides will differ slightly from the numbers in slides 5 & 7 because of different data sources and collection times. The numbers in slide 2 are artificially low due to some missing information in SteemDB from March 7 through March 14.
With 763 SP burned, May 19 was a new entry in the top-4 list. As a result, 3 of the 4 highest days were logged during April or May.
Weekly
May 29, 2022 to present (burnsteem25 era)
| Sidebars |
|---|
Top sidebar summary cards show total number of STEEM, SP, and VESTS burned, as well as the total number of posts with @null beneficiary settings.
In the center-left sidebar is a new table showing the top-4 days in terms of burned beneficiary rewards.
Bottom-left sidebar summary cards show totals for SBD burned in post promotion.
| Graphs |
|---|
Top-left is a graph showing the number of posts and average SP burned per post by month.
Top-right: This shows the VESTS and the estimated SP beneficiary rewards burned per month.
Middle-left: This is a graph showing the number of posts and average SP burned per post, by day.
Middle-right: This shows the daily VESTS and the estimated SP beneficiary rewards that have been burned.
In all of the above graphs, VESTS are shown against the left axis, SP and STEEM are shown against the right.
Bottom: SBD transfers to @null. As readers are likely aware, SBD transfers to @null can get a post added to the /promoted page. The visualization on the left shows a monthly aggregation of SBDs transferred and a count of unique senders. The visualization on the right shows the daily record.
Slide 3: Rewards summary
Unchanged since August 21, 2022, SBD printing has remained paused. With the present SBD supply, it looks like the median on-chain price for STEEM needs to get back to about $0.252 for SBDs to start printing again. The current median price is $0.197. The burn ratio shows at 1.88%, which is up from 1.82% last week, but still includes missing data from March 7 through March 14. This estimate also doesn't account properly for 100% powerup posts.
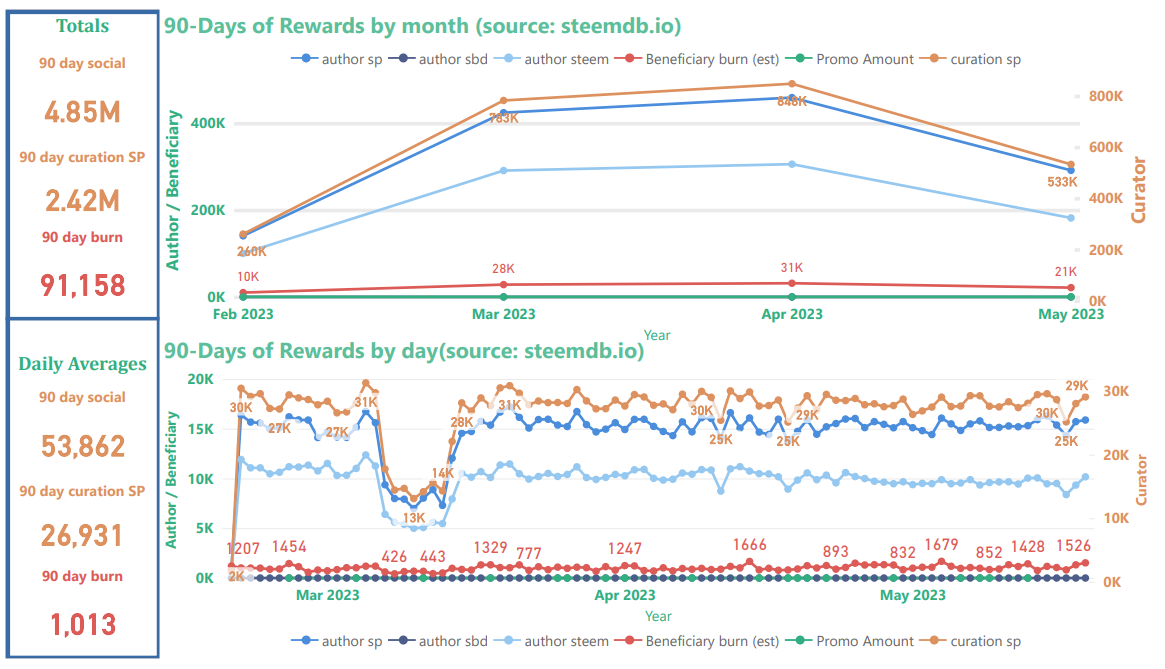
Curator rewards use the scale on the right, author and beneficiary rewards use the scale on the left. Thus, curation rewards appear to be scaled down relative to author & beneficiary rewards. Beneficiary rewards for @null in this chart (red) have been adjusted in order to account for both SP and liquid rewards. The top graph shows the monthly aggregations, and the bottom graph shows daily totals.
The new top-left sidebar shows estimates for the 90-day total of distributed "social rewards" (author, curator, and beneficiary), the 90-day total of curation rewards; and the 90-day total of burned beneficiary rewards.
The new bottom-left sidebar shows estimated daily 90-day averages for the same three values. In both sidebars, "social rewards" are calculated as [curation rewards] * 2. Based on these estimates, the burn rate is about 1.9% of all social rewards (this excludes interest paid for staking, rewards to witnesses, and SBDs to the SPS).
Slide 4: STEEM & SBD Supply as well as vested (i.e. staked or "powered up") STEEM
Noteworthy this week is that liquid STEEM as a percentage of current supply and of virtual supply increased (barely) for the fifth straight week (top-right and bottom-left charts). Also, the current observed inflation rate is now running around 6.67%, which is up from 6.65% last week and down from 6.89% when I started tracking it on November 26, 2022. The value has ranged from 6.65% to 6.89% since I started tracking it.
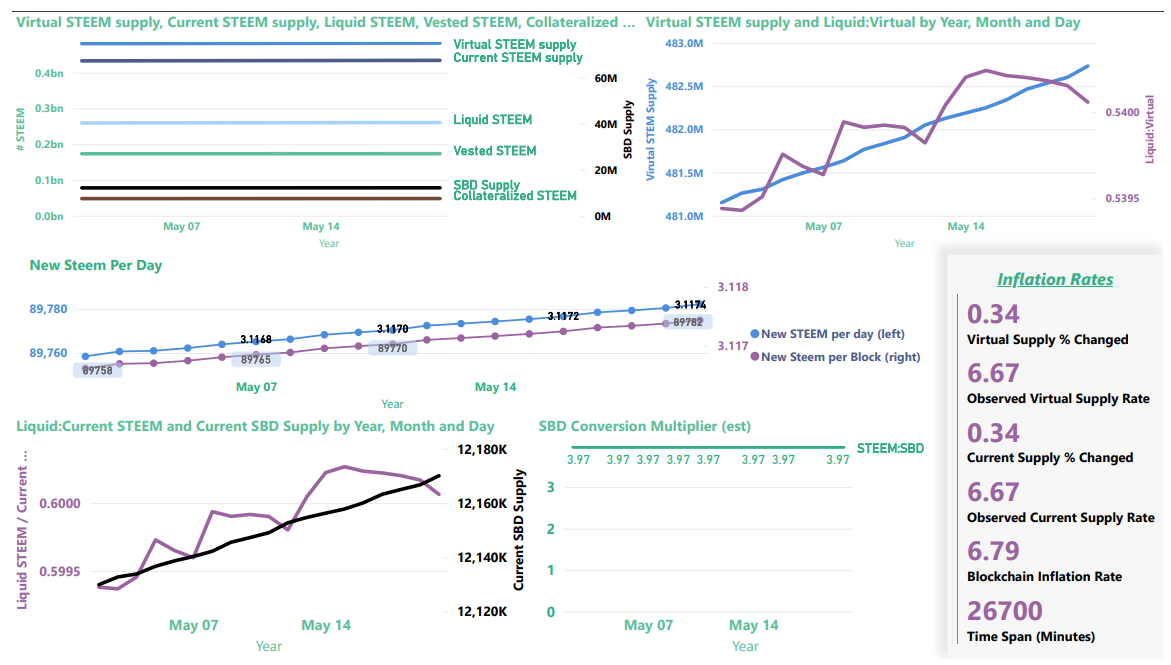
The card in the lower-right corner shows the inflation rates for current_supply and virtual_supply, as calculated from the SteemDB API. It also shows the blockchain's current internal inflation rate.
The top-left image provides a summary view of current and virtual STEEM supply, current SBD supply, liquid and vested STEEM, and the amount of STEEM reserved as collateral for paying off SBDs.
| Note |
|---|
Collateralized STEEM and current SBD supply actually represent the same value expressed in terms of STEEM or SBDs, respectively. They're aligned differently on the graph because they use different axes. |
The top-right graphic now contains a zoom-in on "virtual STEEM Supply" (left axis) and the ratio of liquid STEEM / virutal STEEM supply (right axis). As we learned, here, virtual STEEM supply is heavily influenced by price, so with STEEM prices down, it's not surprising to find the virtual STEEM supply increasing. The up-side of this is that it's now possible to burn more collateralized STEEM per SBD with post promotion.
New as of May 6, 2022: the line graph in the center shows the current inflation in terms of new STEEM per block and new STEEM per day. The slopes of those lines should be identical, since one is a multiple of the other, but they look slightly different because of the different scales from the primary and secondary axes. These are calculated using the formulas from Steemit Corner #2 : Understanding Steem Inflation.
The bottom-left visualization now contains the ratio of liquid STEEM / current STEEM supply (left axis) and a zoom-in on Current SBD supply (right axis)
The chart on the bottom right shows the value of SBDs in terms of STEEM, according to the blockchain conversion rate, not external markets. This is the inverse of the blockchain's: internal price, as explained here.
Now, here are some more details about each of the values
| Parameter | Axis (left/right) | Meaning | Comments |
|---|---|---|---|
| SBD Supply | right | Number of SBDs in circulation | Equivalent in value to collateralized STEEM |
| Collateralized STEEM | left | Number of STEEM needed to pay off all SBD debt | Equivalent in value to SBD Supply |
| Vested STEEM | left | Number of STEEM staked as STEEMPOWER | |
| Liquid STEEM | left | Number of STEEM that's not staked or needed for SBD collateral | Calculated as (Current STEEM supply - Vested STEEM) |
| Current STEEM supply | left | Number of STEEM in circulation | |
| Virtual STEEM supply | left | Number of STEEM in existence |
Slide 5-8
Instead of using steemdb.io, here are the newer visualizations - straight from the blockchain's API. These cover the last week, the last month, the full burnsteem25 era, and throughout the entire blockchain's lifetime.
Since these graphs come straight from the blockchain API, they should not be affected by the above-referenced problem with missing data.
Last week
Last month
May 29, 2022 to present (The burnsteem25 era)
All time
Thanks for reading!
Previous weeks
- Burned tokens, rewards, and inflation summary May 13, 2023: 169K SP, 113K STEEM, and 1,146 SBD burned in 52K burnsteem25 posts
- Burned tokens, rewards, and inflation summary May 6, 2023: 165K SP, 110K STEEM, and 1,146 SBD burned in 51K burnsteem25 posts
- Burned tokens, rewards, and inflation summary April 29, 2023: 161K SP, 107K STEEM, and 1,146 SBD burned in 49K burnsteem25 posts
- Burned tokens, rewards, and inflation summary April 22, 2023: 156K SP, 105K STEEM, and 1,146 SBD burned in 48K burnsteem25 posts
- Burned tokens, rewards, and inflation summary April 15, 2023: 153K SP, 102K STEEM, and 1,146 SBD burned in 47K burnsteem25 posts
- Burned tokens, rewards, and inflation summary April 8, 2023: 149K SP, 100K STEEM, and 1,146 SBD burned in 46K burnsteem25 posts
- Burned tokens, rewards, and inflation summary April 1, 2023: 146K SP, 98K STEEM, and 1,146 SBD burned in 45K burnsteem25 posts
- Burned tokens, rewards, and inflation summary March 25, 2023: 142K SP, 96K STEEM, and 1,146 SBD burned in 44K burnsteem25 posts
- Burned tokens, rewards, and inflation summary March 18, 2023: 138K SP, 93K STEEM, and 1,146 SBD burned in 43K burnsteem25 posts
- Burned tokens, rewards, and inflation summary March 4, 2023: 131K SP, 88K STEEM, and 909 SBD burned in 41K burnsteem25 posts
- Burned tokens, rewards, and inflation summary February 25, 2023: 127K SP, 86K STEEM, and 909 SBD burned in 40K burnsteem25 posts
- Burned tokens, rewards, and inflation summary February 18, 2023: 124K SP, 84K STEEM, and 909 SBD burned in 39K burnsteem25 posts
- Burned tokens, rewards, and inflation summary February 11, 2023: 121K SP, 83K STEEM, and 909 SBD burned in 38K burnsteem25 posts
- Burned tokens, rewards, and inflation summary February 4, 2023: 119K SP, 81K STEEM, and 909 SBD burned in 38K burnsteem25 posts
- Burned tokens, rewards, and inflation summary January 28, 2023: 116K SP, 79K STEEM, and 909 SBD burned in 37K burnsteem25 posts
- Burned tokens, rewards, and inflation summary January 21, 2023: 113K SP, 77K STEEM, and 909K SBD burned in 36K burnsteem25 posts
- Burned tokens, rewards, and inflation summary January 14, 2023: 110K SP, 75K STEEM, and 909K SBD burned in 35K burnsteem25 posts
- Burned tokens, rewards, and inflation summary January 7, 2023 - Total burn estimates: 213K STEEM/SP and 64 SBD
For links to updates from 2022, see:
Pixabay license, source
Reminder
Visit the /promoted page and #burnsteem25 to support the inflation-fighters who are helping to enable decentralized regulation of Steem token supply growth.
Not bad results this week at all. It's good that inflation is not very strong. stays at about the same level. Good luck to you. I'm waiting for a new report.
Thanks for the analysis. Steem ecosystem is a project that will be the most useful. There is an increase compared to last week. This is very positive!
This post has been featured in the latest edition of Steem News...
I wish you a happy day